🔓 Get All Tools for FREE!
- ✅ Click here to open a trading account using our referral link and start trading.
- 📅 After 7 days of active trading under our referral link, you can get access to all tools in your account.
- ⚠️ Keep trading to keep access free — if you're inactive for 7 days, your access will be removed.
- 👉 Already have an account? You can change the IB (introducing broker) to our referral link ( https://one.exnesstrack.org/a/w7syl3vnjb ) and still qualify!
In the world of technical analysis, indicators can be the guiding lights that help traders navigate through the complexities of the market. One such powerful tool is the Ichimoku Cloud, also known as Ichimoku Kinko Hyo. This versatile indicator was developed by Goichi Hosoda in Japan during the 1930s and has since become a staple for traders worldwide, offering insights into trends, momentum, and potential support/resistance levels.
However, while the default settings of the Ichimoku Cloud may work for some, they are not universally suitable for all trading strategies. If you’re a day trader, swing trader, or even a scalper, you might find that the standard parameters don’t fully align with your trading style. Thankfully, customizing the Ichimoku Cloud allows you to fine-tune the indicator for a better fit, providing more precision and adaptability in different market conditions. In this post, we’ll explore what the Ichimoku Cloud is, how it works, and how you can modify it to enhance your trading strategy.
What is the Ichimoku Cloud?
The Ichimoku Cloud is a comprehensive indicator designed to offer traders a holistic view of market conditions. Unlike most other indicators that focus on a single aspect—like moving averages or RSI—the Ichimoku Cloud presents a complete snapshot by simultaneously providing insights into trends, momentum, and key price levels.
🔓 Get All Tools for FREE!
- ✅ Click here to open a trading account using our referral link and start trading.
- 📅 After 7 days of active trading under our referral link, you can get access to all tools in your account.
- ⚠️ Keep trading to keep access free — if you're inactive for 7 days, your access will be removed.
- 👉 Already have an account? You can change the IB (introducing broker) to our referral link ( https://one.exnesstrack.org/a/w7syl3vnjb ) and still qualify!
The Ichimoku Cloud is composed of five key components:
- Tenkan-Sen (Conversion Line): This line represents the average of the highest and lowest prices over the last nine periods. It acts as a short-term indicator that reflects price momentum.
- Kijun-Sen (Base Line): Calculated by averaging the highest and lowest prices over the past 26 periods, this line provides a longer-term view and is often used to identify potential trend reversals.
- Senkou Span A (Leading Span A): This is the average of the Tenkan-Sen and Kijun-Sen, plotted 26 periods into the future. It forms one boundary of the cloud (Kumo).
- Senkou Span B (Leading Span B): Calculated by averaging the highest and lowest prices over the past 52 periods, this line is also plotted 26 periods into the future and forms the second boundary of the cloud.
- Chikou Span (Lagging Span): The closing price plotted 26 periods into the past. This line is used to help confirm trends.

These components work together to form the Kumo (Cloud), a shaded area on the chart that represents key support and resistance levels, as well as trend strength.
How Does the Ichimoku Cloud Work?
The Ichimoku Cloud is highly visual, offering traders a quick glance at market trends and momentum through the changing shape and color of the cloud. Let’s break down how it works:
- Cloud Color: The color of the cloud changes based on the relationship between Leading Span A and Leading Span B.
- When Leading Span A is above Span B, the cloud turns green, signaling a potential uptrend.
- When Leading Span B is above Span A, the cloud turns red, indicating a potential downtrend.
- Trend Identification: The position of the price relative to the cloud is also crucial for identifying trends.
- If the price is above the cloud, it suggests an uptrend.
- If the price is below the cloud, it indicates a downtrend.
- If the price is inside the cloud, the market may be in a consolidation phase, and the trend is unclear.
- Support and Resistance: The cloud also serves as a dynamic support and resistance area. During an uptrend, the upper boundary of the cloud acts as a support zone, while in a downtrend, the lower boundary of the cloud acts as resistance.
- Custom Parameters: By adjusting the parameters of the Tenkan-Sen, Kijun-Sen, and the Leading Spans, you can tailor the Ichimoku Cloud to suit different timeframes and trading styles. For example, you might shorten the periods for faster reactions when scalping, or extend them for longer-term trend analysis.
Customizing the Ichimoku Cloud for Better Precision
While the default settings of the Ichimoku Cloud are 9-26-52 (which are based on old Japanese trading schedules), they may not always fit modern trading environments or individual strategies. That’s where customizing the Ichimoku Cloud comes in. By tweaking the parameters, you can align the indicator with your preferred timeframe, whether you’re day trading, swing trading, or scalping.
How to Adjust Ichimoku Cloud Parameters in TradingView
Step 1: Log into your TradingView account and open your desired chart.
Step 2: Click on the Indicators tab and search for “Ichimoku Cloud.” Add it to your chart.
Step 3: Once added, hover over the indicator and click the settings gear icon.
Step 4: You’ll now see the default settings for the Tenkan-Sen, Kijun-Sen, and Leading Spans. Here’s where you can modify the parameters:
- Tenkan-Sen: Adjust the period for short-term price action.
- Kijun-Sen: Modify the period for a longer-term trend.
- Leading Span A & B: Customize these to shift the cloud boundaries for your specific needs.
Step 5: After adjusting the settings, experiment with different configurations to match your trading style. You can adjust the parameters based on whether you’re trading on shorter timeframes (1-minute, 5-minute charts) or longer ones (daily, weekly charts).
Key Benefits of Using Custom Parameters
- Increased Precision: By fine-tuning the Ichimoku Cloud, you can make the indicator more sensitive to price changes in your chosen timeframe, whether for quick scalping or long-term swing trading.
- Better Adaptation to Modern Markets: Markets have changed since the Ichimoku Cloud was originally designed, and the ability to customize the indicator allows you to better adapt to today’s volatile trading environment.
- Alignment with Your Trading Strategy: Custom parameters give you control over how quickly or slowly the indicator responds to price action, which can align with your specific strategy—be it scalping, swing trading, or position trading.
- Greater Flexibility: Whether you’re trading stocks, forex, or cryptocurrencies, customizing the Ichimoku Cloud helps you better understand market dynamics across different asset classes.
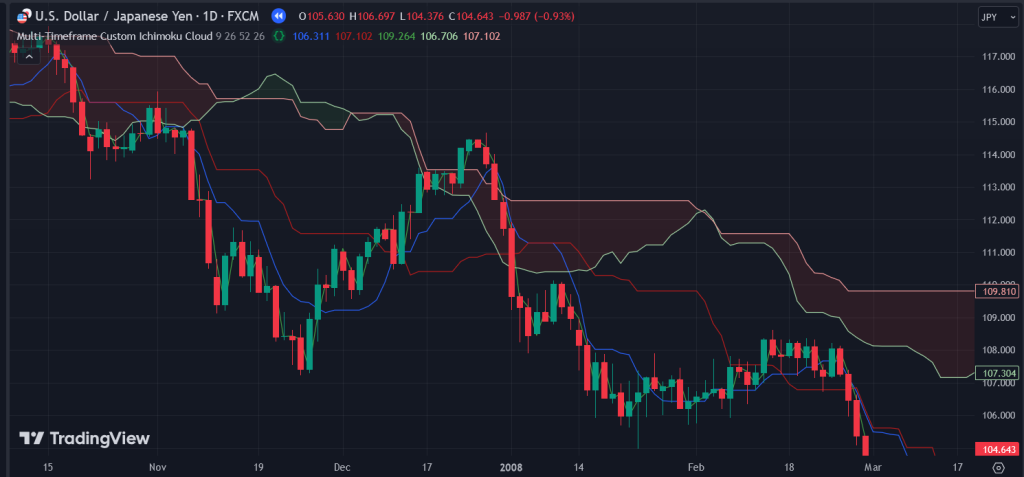
Pinescript using "Multi-Timeframe Custom Ichimoku Cloud"

//@version=5
// insta id algo_aakash
indicator(title="Multi-Timeframe Custom Ichimoku Cloud", overlay=true)
selectedTimeframe = input.timeframe("", title="Timeframe for Ichimoku Cloud")
conversionPeriods = input.int(9, minval=1, title="Conversion Line Length")
basePeriods = input.int(26, minval=1, title="Base Line Length")
laggingSpan2Periods = input.int(52, minval=1, title="Leading Span B Length")
displacement = input.int(26, minval=1, title="Lagging Span")

donchian(len) => math.avg(ta.lowest(len), ta.highest(len))

// Requesting data from a higher timeframe
conversionLineHTF = request.security(syminfo.tickerid, selectedTimeframe, donchian(conversionPeriods))
baseLineHTF = request.security(syminfo.tickerid, selectedTimeframe, donchian(basePeriods))
leadLine1HTF = request.security(syminfo.tickerid, selectedTimeframe, math.avg(conversionLineHTF, baseLineHTF))
leadLine2HTF = request.security(syminfo.tickerid, selectedTimeframe, donchian(laggingSpan2Periods))
laggingSpanHTF = request.security(syminfo.tickerid, selectedTimeframe, close[displacement])

// Plot the Ichimoku lines
plot(conversionLineHTF, color=#2962FF, title="Conversion Line (HTF)")
plot(baseLineHTF, color=#B71C1C, title="Base Line (HTF)")
plot(laggingSpanHTF, offset = -displacement + 1, color=#43A047, title="Lagging Span (HTF)")
p1HTF = plot(leadLine1HTF, offset = displacement - 1, color=#A5D6A7, title="Leading Span A (HTF)")
p2HTF = plot(leadLine2HTF, offset = displacement - 1, color=#EF9A9A, title="Leading Span B (HTF)")

// Fill Kumo cloud between Leading Span A and B
plot(leadLine1HTF > leadLine2HTF ? leadLine1HTF : leadLine2HTF, offset = displacement - 1, title="Kumo Cloud Upper Line (HTF)", display=display.none)
plot(leadLine1HTF < leadLine2HTF ? leadLine1HTF : leadLine2HTF, offset = displacement - 1, title="Kumo Cloud Lower Line (HTF)", display=display.none)
fill(p1HTF, p2HTF, color = leadLine1HTF > leadLine2HTF ? color.rgb(67, 160, 71, 90) : color.rgb(244, 67, 54, 90))

Conclusion
The Ichimoku Cloud is a robust, all-in-one trading tool that offers traders a detailed view of the market, highlighting trends, momentum, and key support/resistance levels. By customizing its parameters, you can enhance its effectiveness to suit your trading strategy, making it an indispensable part of your toolkit. While no indicator guarantees perfect results, the flexibility of the Ichimoku Cloud allows you to adapt and refine your approach, giving you greater confidence and precision in your trades.
Disclaimer
The information provided in this article is for educational purposes only and does not constitute financial advice. Trading involves significant risk, and you should consult with a qualified financial advisor before engaging in any trading activity. Past performance is not indicative of future results. Always trade within your risk tolerance.

0 Comments