🔓 Get All Tools for FREE!
- ✅ Click here to open a trading account using our referral link and start trading.
- 📅 After 7 days of active trading under our referral link, you can get access to all tools in your account.
- ⚠️ Keep trading to keep access free — if you're inactive for 7 days, your access will be removed.
- 👉 Already have an account? You can change the IB (introducing broker) to our referral link ( https://one.exnesstrack.org/a/w7syl3vnjb ) and still qualify!
What is the Modified RSI Indicator?
The Modified RSI Indicator is a powerful enhancement of the traditional Relative Strength Index (RSI), designed to provide traders with greater flexibility and accuracy in identifying overbought and oversold conditions in the market. Built for TradingView using Pine Script, this indicator introduces adjustable features that improve sensitivity, smoothing, and signal clarity, making it a versatile tool for traders in forex, crypto, and stock markets.
This advanced RSI tool combines robust smoothing techniques, customizable thresholds, and intuitive visual cues, allowing traders to make more informed decisions. Whether you’re a beginner or a seasoned trader, the Modified RSI Indicator can help refine your technical analysis strategies on TradingView.
🔓 Get All Tools for FREE!
- ✅ Click here to open a trading account using our referral link and start trading.
- 📅 After 7 days of active trading under our referral link, you can get access to all tools in your account.
- ⚠️ Keep trading to keep access free — if you're inactive for 7 days, your access will be removed.
- 👉 Already have an account? You can change the IB (introducing broker) to our referral link ( https://one.exnesstrack.org/a/w7syl3vnjb ) and still qualify!
How the Modified RSI Works on TradingView
The Modified RSI leverages Pine Script’s capabilities to enhance the standard RSI formula, introducing several key functionalities:
- Sensitivity Control:
- Traders can adjust the indicator’s responsiveness using the
gamma_input. - A higher sensitivity provides quicker responses to price movements, while lower sensitivity smooths out noise, making it adaptable to different trading styles.
- Traders can adjust the indicator’s responsiveness using the
- Smoothing Options:
- The indicator incorporates various moving averages to refine the RSI calculation, including Simple Moving Average (SMA), Exponential Moving Average (EMA), Double Exponential Moving Average (DEMA), Weighted Moving Average (WMA), and Hull Moving Average (HMA).
- Users can select their preferred smoothing method via the
maTypeSelectionsetting, ensuring the indicator aligns with their strategy. - This versatility minimizes false signals and improves the reliability of overbought/oversold conditions.
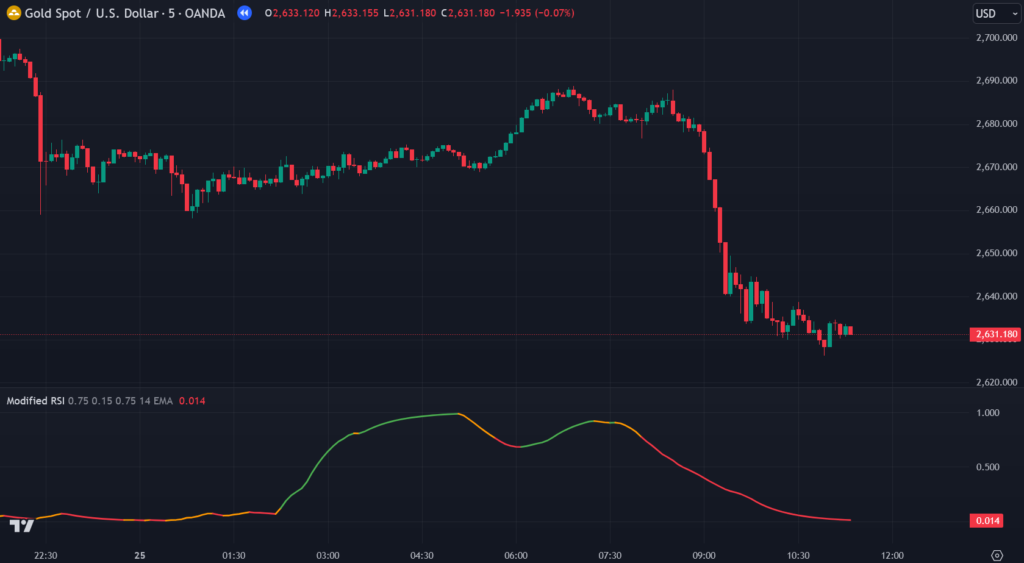
- Custom Overbought and Oversold Levels:
- Standard RSI typically uses levels of 70 for overbought and 30 for oversold. The Modified RSI provides customizable thresholds, set at 0.75 (overbought) and 0.15 (oversold) by default.
- These levels can be fine-tuned to suit different market conditions and asset classes, making it easier to spot high-probability entry and exit points.
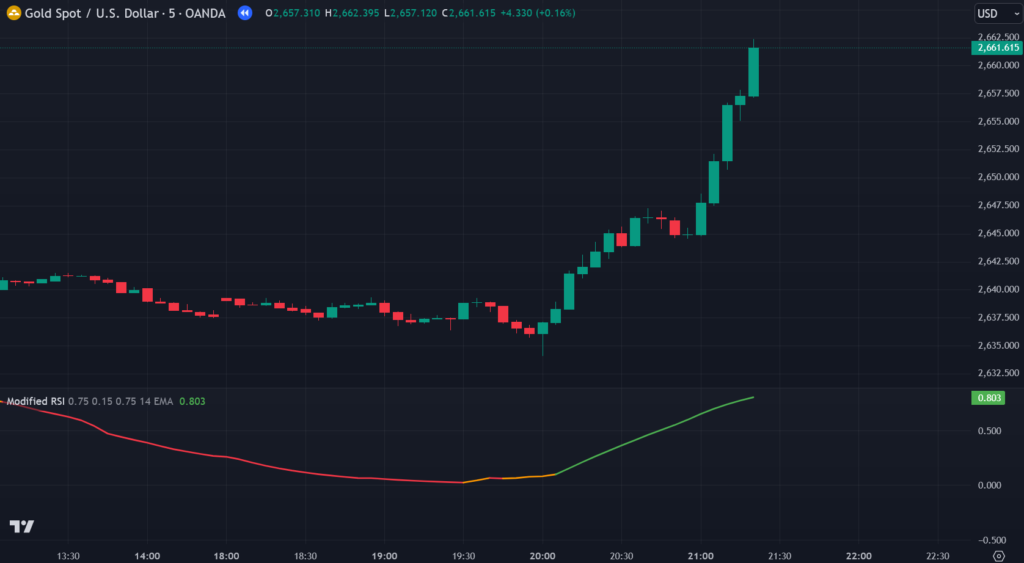
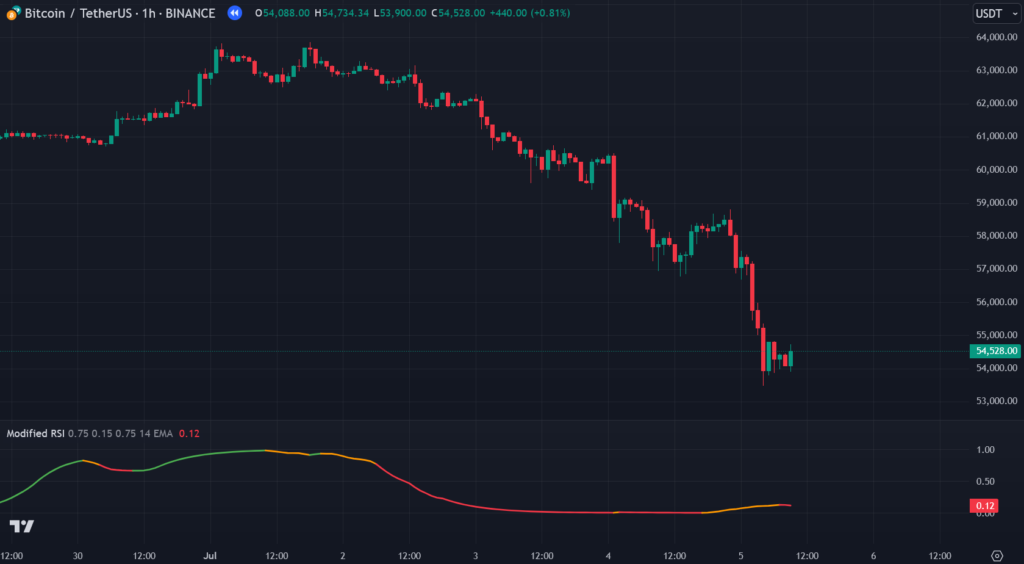
- Color-Coded RSI for Visual Clarity:
- The indicator dynamically changes the RSI line’s color to reflect market conditions:
- Green: RSI rising above the oversold level, signaling bullish momentum.
- Red: RSI falling below the overbought level, indicating bearish momentum.
- Orange: RSI within neutral zones, suggesting indecision.
- These visual cues simplify the interpretation of RSI movements, even at a glance.
- The indicator dynamically changes the RSI line’s color to reflect market conditions:
Benefits of the Modified RSI Indicator
- Improved Signal Accuracy:
- By combining sensitivity adjustments with advanced smoothing techniques, this indicator reduces the noise often associated with traditional RSI signals.
- Versatility Across Markets:
- Works seamlessly across forex, crypto, and stock markets on TradingView.
- Its customizable features make it suitable for scalping, swing trading, and long-term investing.
- User-Friendly Interface:
- The color-coded RSI and intuitive settings ensure that traders of all experience levels can easily incorporate it into their strategies.
- Enhanced Customization:
- Whether you’re looking to tweak sensitivity, apply different moving averages, or set unique thresholds, the Modified RSI Indicator offers unparalleled flexibility.
How to Use the Modified RSI on TradingView
- Add the Indicator to Your Chart:
- Search for the “Modified RSI Indicator” in the TradingView Indicators library or add your custom Pine Script code.
- Apply it to any asset or timeframe to begin analysis.
- Adjust the Settings:
- Open the settings panel to customize sensitivity (
gamma_), smoothing method (maTypeSelection), and overbought/oversold thresholds. - Experiment with different configurations to optimize the indicator for your trading style.
- Open the settings panel to customize sensitivity (
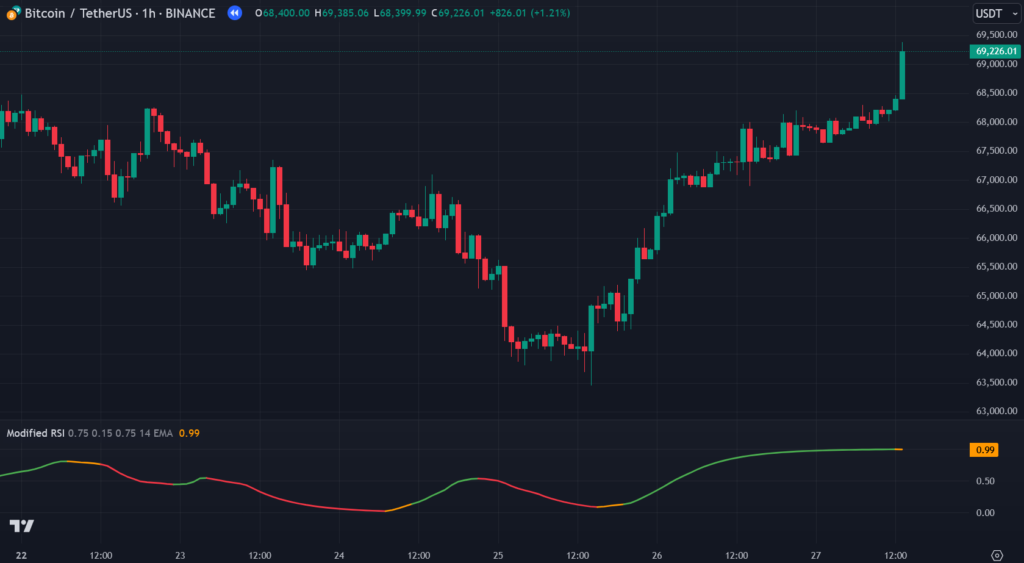
- Interpret Signals:
- Look for green RSI lines rising above the oversold level to identify potential bullish reversals.
- Watch for red RSI lines falling below the overbought level to spot bearish reversals.
- Use orange RSI movements as cautionary signals, indicating sideways or indecisive markets.
- Combine with Other Indicators:
- For best results, pair the Modified RSI with complementary tools like moving averages, trendlines, or volume indicators.
Why Use the Modified RSI on TradingView?
TradingView is the ideal platform for deploying advanced indicators like the Modified RSI. With its robust charting tools and Pine Script capabilities, TradingView allows traders to create, customize, and backtest strategies with ease.
- Flexibility: Traders can apply the Modified RSI to any timeframe, from intraday charts to weekly and monthly views.
- Advanced Customization: TradingView’s Pine Script language ensures the indicator is both precise and adaptable, catering to diverse trading needs.
- Visual Insights: The platform’s sleek interface complements the Modified RSI’s color-coded design, providing clear and actionable signals.
By leveraging this indicator on TradingView, traders can gain a competitive edge in their technical analysis, making smarter decisions backed by data-driven insights.
Conclusion
The Modified RSI Indicator is a must-have tool for traders seeking to refine their strategies on TradingView. By integrating advanced features like sensitivity control, multiple smoothing options, and customizable thresholds, it offers unparalleled precision in detecting overbought and oversold conditions.
Built with Pine Script, this indicator empowers traders with the flexibility to adapt to various market conditions and trading styles. Whether you’re navigating volatile crypto markets, trending stocks, or steady forex pairs, the Modified RSI Indicator ensures you’re equipped to make data-driven decisions with confidence.
Unlock the full potential of your TradingView experience by incorporating the Modified RSI Indicator into your toolkit today!
Pinescript of Modified RSI Tradingview Indicator
Contact us at +91 7620658346 to access this indicator. We provide professional algorithm development services for TradingView, MT4/MT5, and trading bots.
Stay updated by following @algo_aakash on Instagram, YouTube, and Twitter.
Disclaimer
The information provided in this article and any related indicators is for educational purposes only. Trading in financial markets carries significant risk, and there is no guarantee of profit. The custom Bollinger Band strategy is based on historical data and technical analysis, which may not predict future market movements. Users should conduct their own research, assess their risk tolerance, and consult a licensed financial advisor before making any trading decisions. The author and developer of this indicator are not responsible for any losses incurred from using this strategy. Trade responsibly.
Click here to interact with the feature.
🔓 Get This Tool for FREE!
- ✅ Click here to open a trading account using our referral link and start trading.
- 💡 Use coupon code: FREE during checkout.
- 📅 After 7 days of active trading under our referral link, you’ll get access to this tool in your account.
- ⚠️ Keep trading to keep access free — if you're inactive for 7 days, your access will be removed.
- 👉 Already have an account? You can change the IB (introducing broker) to our referral link and still qualify!

2 Comments
Sudarshan · December 17, 2024 at 4:04 am
Algo
xpertstiml1001 · December 17, 2024 at 9:10 am
Contact at +917620658346 For your requirements