🔓 Get All Tools for FREE!
- ✅ Click here to open a trading account using our referral link and start trading.
- 📅 After 7 days of active trading under our referral link, you can get access to all tools in your account.
- ⚠️ Keep trading to keep access free — if you're inactive for 7 days, your access will be removed.
- 👉 Already have an account? You can change the IB (introducing broker) to our referral link ( https://one.exnesstrack.org/a/w7syl3vnjb ) and still qualify!
In the fast-paced world of trading, accurate and efficient tools are essential for success. This article delves into an innovative Buy & Sell Indicator built using Pine Script on TradingView. Designed to enhance decision-making, this indicator combines the strengths of RSI (Relative Strength Index), Stochastic Oscillator (Stoch), and Awesome Oscillator (AO) with MACD (Moving Average Convergence Divergence) and Bollinger Bands to provide reliable trading signals.
What Is the Buy & Sell Indicator?
The Buy & Sell Indicator is a cutting-edge trading tool that generates clear buy and sell signals based on a combination of technical analysis metrics. Its algorithm analyzes price trends, momentum, and volatility to help traders identify high-probability entry and exit points in the market.
🔓 Get All Tools for FREE!
- ✅ Click here to open a trading account using our referral link and start trading.
- 📅 After 7 days of active trading under our referral link, you can get access to all tools in your account.
- ⚠️ Keep trading to keep access free — if you're inactive for 7 days, your access will be removed.
- 👉 Already have an account? You can change the IB (introducing broker) to our referral link ( https://one.exnesstrack.org/a/w7syl3vnjb ) and still qualify!
Key Features:
- Multi-Indicator Strategy: Combines RSI, Stoch, AO, and MACD with Bollinger Bands and the 200 EMA for precise signals.
- Risk Management Built-In: Automatically suggests stop-loss and take-profit levels for optimized risk-reward ratios.
- Customizable Settings: Allows traders to adjust parameters based on market conditions and personal trading styles.
How Buy & Sell Indicator Indicator Works on TradingView
TradingView is the preferred platform for using this indicator, offering seamless integration and real-time charting. Here’s a breakdown of how the indicator functions:
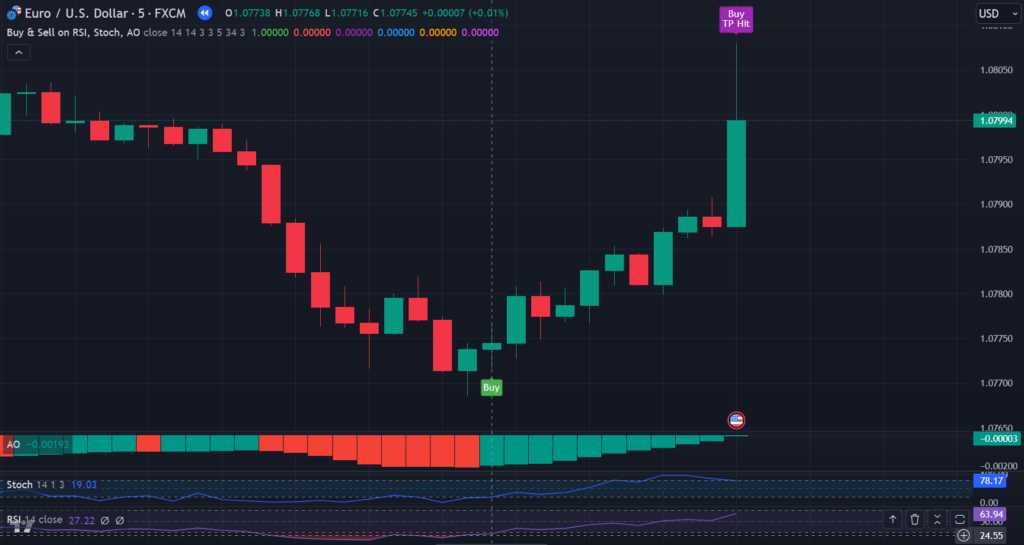
Buy Signal Logic
- MACD Line Breaks the Upper Bollinger Band: This indicates a strong upward momentum in price.
- Price Above the 200 EMA: Confirms a bullish trend, ensuring the signal aligns with the market’s overall direction.
- Actionable Trade Setup:
- Enter a buy position when the signal is triggered.
- Place the stop loss at the recent swing low for protection.
- Set a take profit at a 1:2 risk-reward ratio, optimizing potential gains relative to risk.
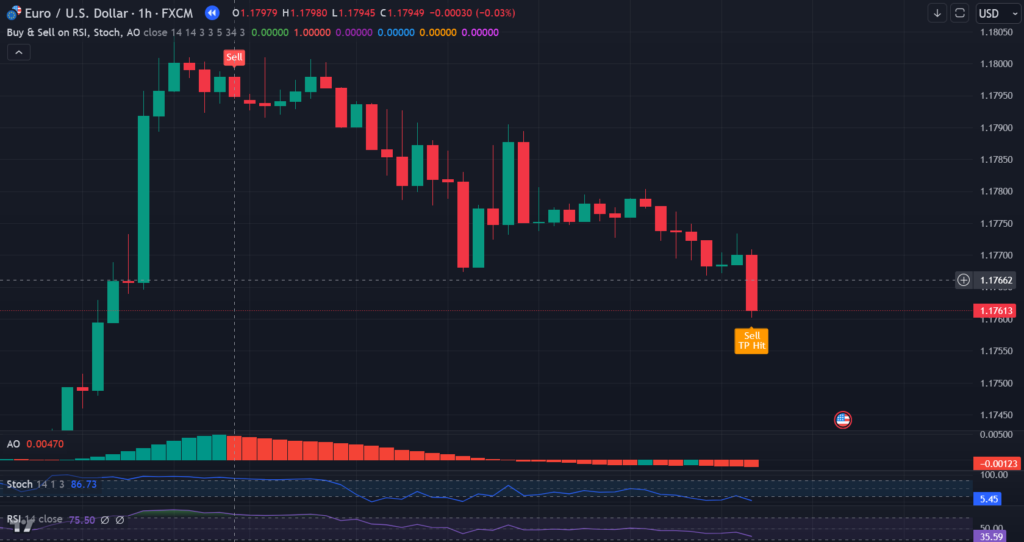
Sell Signal Logic
- MACD Line Falls Below the Lower Bollinger Band: Suggests a significant downward price movement.
- Price Below the 200 EMA: Confirms a bearish trend, validating the sell signal.
- Actionable Trade Setup:
- Enter a sell position when the signal is activated.
- Place the stop loss at the recent swing high.
- Set a take profit at a 1:2 risk-reward ratio for consistent profitability.
Why Use This Indicator on TradingView?
- Comprehensive Analysis: By incorporating multiple indicators, the tool ensures robust signal accuracy, helping traders capitalize on market trends.
- Real-Time Updates: Thanks to TradingView’s dynamic charting capabilities, the signals update in real time, enabling timely decision-making.
- Ease of Use: The indicator simplifies complex analyses, making it accessible even for novice traders.
- Customizability: Built using Pine Script, this tool can be fine-tuned to adapt to varying trading environments, whether forex, crypto, or stocks.
Benefits of Combining RSI, Stoch, and AO with MACD and Bollinger Bands
- RSI and Stoch: Measure momentum and overbought/oversold levels, highlighting potential reversals.
- Awesome Oscillator (AO): Confirms the strength of the trend.
- MACD and Bollinger Bands: Provide a precise mechanism for spotting price breakouts and breakdowns.
- 200 EMA: Acts as a trend filter, ensuring signals align with the broader market direction.
Example Scenarios
Buy Trade Setup
Imagine a stock currently trading at $100. The MACD line crosses above the upper Bollinger Band, and the price is above the 200 EMA.
- Entry Price: $100
- Stop Loss: $95 (recent swing low)
- Take Profit: $110 (1:2 risk-reward)
Sell Trade Setup
Consider a cryptocurrency trading at $500. The MACD line dips below the lower Bollinger Band, with the price trending below the 200 EMA.
- Entry Price: $500
- Stop Loss: $520 (recent swing high)
- Take Profit: $460 (1:2 risk-reward)
Using the Indicator for Strategic Trading
- Trend Identification: Use the 200 EMA to determine the overall market direction.
- Signal Confirmation: Rely on RSI, Stoch, and AO to validate momentum.
- Precision Execution: Enter trades only when MACD interacts with Bollinger Bands as per the indicator rules.
- Risk Management: Always adhere to the suggested stop-loss and take-profit levels.
Conclusion
The Buy & Sell Indicator for TradingView is a versatile tool that simplifies trading decisions by merging advanced technical analysis metrics into a cohesive strategy. Built using Pine Script, it offers a powerful solution for traders seeking to optimize their entries, exits, and risk management. Whether you’re trading forex, stocks, or cryptocurrencies, this indicator provides actionable insights to improve your trading performance.
Start using this indicator on TradingView today to unlock the full potential of algorithmic trading and take your strategies to the next level!
Pinescript of Buy & Sell Indicator TradingView Indicator

Contact us at +91 7620658346 to get access to this indicator. We offer custom algorithm development for TradingView, MT4/MT5, and trading bots.
Don’t forget to follow us on Instagram, YouTube, and Twitter @algo_aakash for more updates!
Disclaimer
The content in this article and any related indicators is for educational purposes only. Trading in financial markets involves substantial risk, and there is no guarantee of profit. The custom Bollinger Band strategy is based on historical data and technical analysis, which may not accurately reflect future market conditions. Users should conduct their own research, evaluate their risk tolerance, and consult with a licensed financial advisor before making any trading decisions. The author and developer of this indicator are not responsible for any losses incurred through the use of this strategy. Please trade responsibly.
Click here to interact with the feature.
🔓 Get This Tool for FREE!
- ✅ Click here to open a trading account using our referral link and start trading.
- 💡 Use coupon code: FREE during checkout.
- 📅 After 7 days of active trading under our referral link, you’ll get access to this tool in your account.
- ⚠️ Keep trading to keep access free — if you're inactive for 7 days, your access will be removed.
- 👉 Already have an account? You can change the IB (introducing broker) to our referral link and still qualify!

0 Comments