🔓 Get All Tools for FREE!
- ✅ Click here to open a trading account using our referral link and start trading.
- 📅 After 7 days of active trading under our referral link, you can get access to all tools in your account.
- ⚠️ Keep trading to keep access free — if you're inactive for 7 days, your access will be removed.
- 👉 Already have an account? You can change the IB (introducing broker) to our referral link ( https://one.exnesstrack.org/a/w7syl3vnjb ) and still qualify!
The financial markets are a constant ebb and flow of price movements, oscillating between phases of volatility and calm. Traders often seek to take advantage of these dynamic shifts, and one of the most lucrative phases to target is market consolidation. During consolidation, price movements are tightly contained within a defined range, indicating that the market is in a state of indecision. The Consolidation Zone Breakout Indicator is a powerful tool designed to identify such phases and provide traders with valuable insights into potential breakout opportunities.
This article will delve into how the Consolidation Zone Breakout Indicator works, its functionality in TradingView, and how it can be used to generate actionable buy or sell signals. If you’re a trader looking to enhance your strategy by capitalizing on breakouts from consolidation zones, this indicator could be an essential addition to your toolkit.
What is the Consolidation Zone Breakout Indicator?
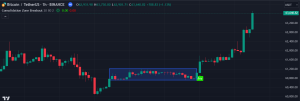
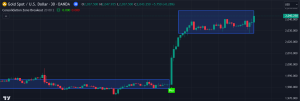
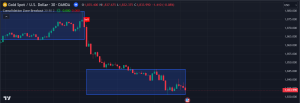
The Consolidation Zone Breakout Indicator identifies market phases where the price remains confined within a narrow range, commonly referred to as consolidation. During this period, there is little movement beyond a certain high and low boundary. The indicator marks the highest high and the lowest low within a user-defined period and draws a box around this range, visually highlighting the consolidation zone on a chart.
🔓 Get All Tools for FREE!
- ✅ Click here to open a trading account using our referral link and start trading.
- 📅 After 7 days of active trading under our referral link, you can get access to all tools in your account.
- ⚠️ Keep trading to keep access free — if you're inactive for 7 days, your access will be removed.
- 👉 Already have an account? You can change the IB (introducing broker) to our referral link ( https://one.exnesstrack.org/a/w7syl3vnjb ) and still qualify!
Once the price breaks out of the consolidation range—either above the highest high or below the lowest low—the indicator generates buy or sell signals depending on the breakout direction. Traders can use these signals to spot new market trends and take advantage of the momentum created by these breakouts.
Unlocking the Power of the Consolidation Zone Breakout Indicator for Effective Trading
How the Consolidation Zone Breakout Indicator Works in TradingView
1. Consolidation Period Detection
The key feature of this indicator is its ability to detect consolidation periods. Using a customizable lookback period, the script calculates the highest high and lowest low for the defined period. This period can be adjusted based on the asset’s behavior, market conditions, or the trader’s preferred trading style. The shorter the lookback period, the more frequent the potential breakouts, though this may also increase the number of false signals. On the other hand, a longer period smooths out market noise but may delay trade entries.
2. Drawing the Consolidation Box
Once the highest high and lowest low are determined, the indicator draws a box on the chart around the consolidation range. This box visually represents the price confinement, making it easy for traders to spot areas where the market is consolidating. It acts as a boundary for price movements, showing when the market is in a holding pattern before a potential breakout.
3. Breakout Detection
The most critical feature of the Consolidation Zone Breakout Indicator is detecting when the price breaks out of the box, either to the upside or downside. A breakout occurs when the price closes outside the consolidation range.
- Bullish Breakout: If the price moves above the top of the box (the highest high), this is seen as a bullish breakout, signaling an upward trend. The indicator marks this with a buy signal.
- Bearish Breakout: If the price moves below the bottom of the box (the lowest low), it signals a bearish breakout, marking a potential downtrend. The indicator plots a sell signal.
Breakouts are essential to the strategy because they signify a transition from a phase of indecision to a period of decisive market movement. Traders who can enter trades shortly after a breakout stand to benefit from the subsequent price movement, assuming the breakout continues.
4. Buy and Sell Signals with Alerts
After detecting a breakout, the indicator automatically plots buy or sell signals on the chart, depending on the breakout direction. Traders can further enhance this by enabling alerts within TradingView. This means that whenever the price breaks out of the consolidation range, the trader receives a notification in real-time, ensuring they don’t miss crucial trading opportunities.
How to Use the Consolidation Zone Breakout Indicator in Trading
The Consolidation Zone Breakout Indicator is a versatile tool that can be used in a variety of trading strategies. Here’s a step-by-step guide on how to effectively use it in your trading process:
1. Identify Consolidation Periods
First, look for consolidation phases where the price is confined to a narrow range. These are typically periods of reduced volatility and can signal that the market is preparing for a significant move. The Consolidation Zone Breakout Indicator highlights these phases by drawing the consolidation box.
2. Wait for a Breakout
Once a consolidation phase is identified, patience is key. Traders should wait for the price to break out of the consolidation zone before entering a trade. Depending on the direction of the breakout, the indicator will suggest a buy or sell signal.
- For a bullish breakout, consider taking a long position as the price moves above the top of the consolidation box.
- For a bearish breakout, a short position might be more appropriate as the price breaks below the bottom of the box.
3. Set Stop-Loss and Take-Profit Levels
It is essential to manage risk when trading breakouts. A common strategy is to place a stop-loss order just outside the opposite side of the consolidation zone. For example, in a bullish breakout, a stop-loss can be placed just below the consolidation box’s lower boundary. In a bearish breakout, the stop-loss should be placed above the top of the box. This limits potential losses if the breakout turns out to be false.
Take-profit levels can be set based on predetermined risk-reward ratios or using other technical indicators, such as Fibonacci extensions or support/resistance levels.
4. Use Alerts for Real-Time Trading
Trading breakouts can be time-sensitive, which is why setting up alerts is a crucial part of the strategy. The Consolidation Zone Breakout Indicator allows you to set alerts in TradingView, ensuring that you are notified the moment a breakout occurs, even if you’re not actively monitoring the chart.
Advantages of the Consolidation Zone Breakout Indicator
- Simplicity and Clarity: The indicator provides a clear and straightforward approach to identifying consolidation zones and breakouts, making it accessible to both beginner and advanced traders.
- Customizable Lookback Period: Traders can customize the lookback period to fine-tune the indicator to their preferred trading style, allowing flexibility for different assets and timeframes.
- Real-Time Alerts: With TradingView’s built-in alert system, traders can set real-time notifications for breakout events, ensuring they don’t miss any significant price movements.
- Breakout Trading Opportunities: The indicator provides clear buy and sell signals, making it easier for traders to spot potential market trends and capitalize on them.
Unlocking the Power of the Consolidation Zone Breakout Indicator for Effective Trading
//@version=5
//insta id algo_aakash
indicator(“Consolidation Zone Breakout”, overlay=true)
// Inputs for user customization
consolidationPeriod = input.int(20, title=”Consolidation Period”, minval=1)
boxColor = input.color(color.blue, title=”Box Color”)
breakoutColorUp = input.color(color.green, title=”Breakout Up Color”)
breakoutColorDown = input.color(color.red, title=”Breakout Down Color”)
boxTransparency = input.int(80, title=”Box Transparency”, minval=0, maxval=100)
highlightBreakout = input.bool(true, title=”Highlight Breakout?”)
boxLineWidth = input.int(2, title=”Box Line Width”, minval=1, maxval=5)
showBuySellSignals = input.bool(true, title=”Show Buy/Sell Signals?”)
// Calculate the highest high and lowest low over the consolidation period
highestHigh = ta.highest(high, consolidationPeriod)
lowestLow = ta.lowest(low, consolidationPeriod)
// Define consolidation condition: price range is tight
rangeCondition = (highestHigh – lowestLow) < (ta.sma(close, consolidationPeriod) * 0.01)
// Draw the consolidation box during consolidation
var box consolidationBox = na
var buyOpen = true
var sellOpen = true
if rangeCondition
// If no box exists, create one
if na(consolidationBox)
consolidationBox := box.new(left=bar_index[consolidationPeriod], right=bar_index, top=highestHigh, bottom=lowestLow, border_color=boxColor, border_width=boxLineWidth, bgcolor=color.new(boxColor, boxTransparency))
else
// Update the box dynamically
box.set_top(consolidationBox, highestHigh)
box.set_bottom(consolidationBox, lowestLow)
box.set_right(consolidationBox, bar_index)
else
// Delete the box when the range condition is no longer met
if not na(consolidationBox)
if close > box.get_top(consolidationBox)
buyOpen := true
if close < box.get_bottom(consolidationBox)
sellOpen := true
consolidationBox := na
// top = box.get_top(consolidationBox)
// bottom = box.get_bottom(consolidationBox)
// Breakout conditions
// breakoutUp = close > top and buyOpen
// breakoutDown = close < bottom and sellOpen
breakoutUp = buyOpen
breakoutDown = sellOpen
// Optional: Highlight breakouts with background color
// bgcolor(breakoutUp and highlightBreakout ? color.new(breakoutColorUp, boxTransparency) : na)
// bgcolor(breakoutDown and highlightBreakout ? color.new(breakoutColorDown, boxTransparency) : na)
// Generate alerts for breakouts
alertcondition(breakoutUp, title=”Bullish Breakout”, message=”Price has broken above the consolidation zone!”)
alertcondition(breakoutDown, title=”Bearish Breakout”, message=”Price has broken below the consolidation zone!”)
// Plot Buy and Sell signals based on breakout
// if showBuySellSignals
plotshape(breakoutUp, style=shape.labelup, location=location.belowbar, color=#1be100, size=size.tiny, title=’Buy’, text=’Buy’, textcolor=color.white)
plotshape( breakoutDown, style=shape.labeldown, location=location.abovebar, color=#fc0000, size=size.tiny, title=’Sell’, text=’Sell’, textcolor=color.white)
if breakoutUp
buyOpen := false
// sellOpen := true
if breakoutDown
// buyOpen := true
sellOpen := false
Unlocking the Power of the Consolidation Zone Breakout Indicator for Effective Trading
Conclusion
The Consolidation Zone Breakout Indicator is a powerful tool for traders looking to identify consolidation phases and capitalize on breakouts. By visually marking consolidation zones and providing actionable buy or sell signals, this indicator can help traders make informed trading decisions. Whether you are a day trader, swing trader, or long-term investor, incorporating the Consolidation Zone Breakout Indicator into your strategy could be the key to unlocking more profitable trades.
Disclaimer:
The information provided in this article is for educational purposes only and should not be considered financial or trading advice. Trading in financial markets involves risk, and individuals should perform their own due diligence before making any trading decisions. Past performance does not guarantee future results. Always consult with a qualified financial advisor or professional before engaging in any trading activity.
0 Comments