🔓 Get All Tools for FREE!
- ✅ Click here to open a trading account using our referral link and start trading.
- 📅 After 7 days of active trading under our referral link, you can get access to all tools in your account.
- ⚠️ Keep trading to keep access free — if you're inactive for 7 days, your access will be removed.
- 👉 Already have an account? You can change the IB (introducing broker) to our referral link ( https://one.exnesstrack.org/a/w7syl3vnjb ) and still qualify!
In the dynamic world of financial markets, identifying potential buy and sell opportunities is a constant pursuit for traders. One popular technical analysis tool that has gained significant traction is the Bollinger Bands indicator.This indicator, developed by John Bollinger, provides valuable insights into market volatility and can help traders make informed decisions.
What is the Bollinger Bands Indicator?
The Bollinger Bands Indicator is a popular technical analysis tool used by traders to assess market volatility and identify potential buy or sell opportunities. Developed by John Bollinger in the early 1980s, this indicator plots three key lines on a price chart: the middle band (usually a Simple Moving Average, or SMA) and two outer bands (the upper and lower bands), which are calculated based on standard deviations from the SMA.
The key feature of the Bollinger Bands Indicator is its ability to adapt to changing market conditions. When the market is experiencing high volatility, the bands widen; conversely, during low volatility, the bands contract. This dynamic nature makes Bollinger Bands an essential tool for traders looking to make informed decisions based on price movements relative to the bands.
🔓 Get All Tools for FREE!
- ✅ Click here to open a trading account using our referral link and start trading.
- 📅 After 7 days of active trading under our referral link, you can get access to all tools in your account.
- ⚠️ Keep trading to keep access free — if you're inactive for 7 days, your access will be removed.
- 👉 Already have an account? You can change the IB (introducing broker) to our referral link ( https://one.exnesstrack.org/a/w7syl3vnjb ) and still qualify!
Understanding the Bollinger Bands Indicator: Your Guide to Trading Success
How Does the Indicator Work on TradingView?
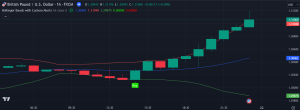
1. Buy Signal: Capturing Oversold Conditions
One of the most important functions of the Bollinger Bands Indicator is its capability to generate buy signals. A buy signal occurs when the price crosses above the lower band. This movement typically indicates an oversold condition, suggesting that the asset may be undervalued.
The rationale is straightforward: when prices drop significantly below the lower band, a rebound is likely as the market seeks to correct itself. Traders can seize this opportunity to enter a position at a relatively lower price, positioning themselves for potential gains when the price rebounds towards the SMA.
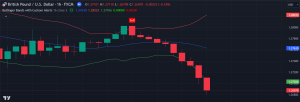
2. Sell Signal: Identifying Overbought Conditions
Conversely, sell signals are triggered when the price crosses below the upper band. This signal often signifies an overbought condition, indicating that the asset may be overvalued and due for a price correction.
When prices rise significantly above the upper band, traders should be cautious, as this can lead to a downturn. By placing sell orders at this point, traders can effectively lock in profits and mitigate potential losses. The ability to recognize these conditions is crucial for maintaining a balanced trading strategy.
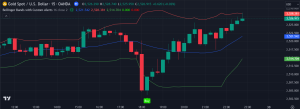
3. One Trade Rule: Promoting Disciplined Trading
To further enhance trading discipline, the Bollinger Bands Indicator includes a unique “One Trade Rule.” This rule permits only one buy signal to be followed by one sell signal, thereby preventing traders from being overwhelmed by multiple signals in a short timeframe.
This feature is particularly valuable for traders who might otherwise make impulsive decisions based on fleeting price movements. By enforcing this one-to-one trading structure, the indicator encourages a more methodical approach, allowing traders to focus on high-probability setups rather than chasing every signal.
4. Alerts: Staying Informed in Real-Time
In addition to generating visual signals, the Bollinger Bands Indicator also offers customizable alerts. Traders can set up alerts to notify them when overbought or oversold conditions are detected, ensuring they stay ahead of market movements without constant chart monitoring.
Setting up alerts in TradingView is straightforward. Traders can define specific conditions under which they wish to be notified, allowing them to act promptly when opportunities arise.
Practical Tips for Using the Bollinger Bands Indicator
- Combine with Other Indicators: While Bollinger Bands can be powerful on their own, combining them with other indicators like the Relative Strength Index (RSI) or Moving Average Convergence Divergence (MACD) can enhance the accuracy of trading signals and provide a more comprehensive market view.
- Adjust Settings to Fit Market Conditions: The default settings for the Bollinger Bands (typically a 20-period SMA and 2 standard deviations) may not suit all trading strategies or asset classes. It’s important for traders to adjust these parameters based on the asset’s volatility and their specific trading approach.
- Implement Strong Risk Management: As with any trading strategy, effective risk management is essential. Traders should establish stop-loss orders to protect their capital against sudden market fluctuations and ensure that their trades align with their overall risk tolerance.
- Backtest Your Strategy: Before applying the Bollinger Bands Indicator in live trading, consider backtesting your strategy using historical price data. This process will help you evaluate the indicator’s performance in various market conditions and refine your approach.
Understanding the Bollinger Bands Indicator: Your Guide to Trading Success
//@version=5
// insta id algo_aakash
indicator(“Bollinger Bands with Custom Alerts “, overlay=true)
// Input for Bollinger Bands
length = input.int(20, title=”Bollinger Bands Length”)
src = input(close, title=”Source”)
mult = input.float(2.0, title=”Bollinger Bands Multiplier”)
// Bollinger Bands Calculation
basis = ta.sma(src, length)
dev = mult * ta.stdev(src, length)
upperBand = basis + dev
lowerBand = basis – dev
// Plot Bollinger Bands
plot(basis, color=color.blue, linewidth=1, title=”Middle Band”)
plot(upperBand, color=color.red, linewidth=1, title=”Upper Band”)
plot(lowerBand, color=color.green, linewidth=1, title=”Lower Band”)
// Define Overbought and Oversold Conditions
isOverbought = close >= upperBand
isOversold = close <= lowerBand
// Logic for One Buy after One Sell
var bool canBuy = true // Initialize state to allow buying first
var bool canSell = false // Initialize state to disallow selling until a buy happens
var bool buySignal = na // Store buy signal state
var bool sellSignal = na // Store sell signal state
// Breakout Condition: Price moving beyond the bands
isUpperBreakout = close > upperBand
isLowerBreakout = close < lowerBand
buySignal := ta.crossover(close,lowerBand) and canBuy
sellSignal := ta.crossunder(close,upperBand) and canSell
plotshape(buySignal, style=shape.labelup, location=location.belowbar, color=#1be100, size=size.tiny, title=’Buy’, text=’Buy’, textcolor=color.white)
plotshape( sellSignal, style=shape.labeldown, location=location.abovebar, color=#fc0000, size=size.tiny, title=’Sell’, text=’Sell’, textcolor=color.white)
// Alerts for Overbought (Price above Upper Band) and Oversold (Price below Lower Band)
alertcondition(isOverbought and canSell, title=”Overbought Alert”, message=”Price is Overbought: Above Upper Bollinger Band (Sell Signal)”)
alertcondition(isOversold and canBuy, title=”Oversold Alert”, message=”Price is Oversold: Below Lower Bollinger Band (Buy Signal)”)
if buySignal
canBuy := false // Disallow further buys
canSell := true // Allow sell after buy
if sellSignal
canBuy := true // Disallow further buys
canSell := false // Allow sell after buy
// Alerts for Breakouts
alertcondition(isUpperBreakout, title=”Upper Band Breakout”, message=”Price Breakout Above Upper Bollinger Band”)
alertcondition(isLowerBreakout, title=”Lower Band Breakout”, message=”Price Breakout Below Lower Bollinger Band”)
Understanding the Bollinger Bands Indicator: Your Guide to Trading Success
Conclusion
The Bollinger Bands Indicator is an invaluable tool for traders seeking to navigate the complexities of market volatility. By effectively identifying oversold and overbought conditions, generating custom buy and sell signals, and promoting disciplined trading through the one trade rule, traders can approach the market with increased confidence and precision.
Disclaimer:
This article is for informational purposes only and does not constitute financial advice. Trading carries significant risks, and it is crucial to conduct thorough research and consult with a financial advisor before making any investment decisions.
0 Comments