🔓 Get All Tools for FREE!
- ✅ Click here to open a trading account using our referral link and start trading.
- 📅 After 7 days of active trading under our referral link, you can get access to all tools in your account.
- ⚠️ Keep trading to keep access free — if you're inactive for 7 days, your access will be removed.
- 👉 Already have an account? You can change the IB (introducing broker) to our referral link ( https://one.exnesstrack.org/a/w7syl3vnjb ) and still qualify!
If you’re an active trader on TradingView, you know that identifying key price zones is critical for making informed decisions. The Transient Zones Insights indicator, built using Pine Script, is a powerful tool designed to help traders spot crucial price zones where price reversals might occur. By analyzing these transient zones (TZ), the indicator provides valuable insights into potential trend reversals, breakout points, and key levels where price action might shift. Let’s dive deep into how this indicator works, its features, and how it can be leveraged for better trading decisions.
What is the Transient Zones Insights Indicator?
The Transient Zones Insights indicator on TradingView helps identify significant price zones based on the left and right zone sizes, highlighting areas where price action could reverse. The indicator evaluates the central zone, determining whether it’s the highest or lowest point within a specified range. This central zone analysis helps plot shapes and signals that alert traders to transient zones (TZ) where potential price reversals could occur.
In simpler terms, it focuses on detecting areas of potential price movement reversals by marking specific zones in price history, offering insights into where trends may shift. These zones are essential for determining strategic entry and exit points.
🔓 Get All Tools for FREE!
- ✅ Click here to open a trading account using our referral link and start trading.
- 📅 After 7 days of active trading under our referral link, you can get access to all tools in your account.
- ⚠️ Keep trading to keep access free — if you're inactive for 7 days, your access will be removed.
- 👉 Already have an account? You can change the IB (introducing broker) to our referral link ( https://one.exnesstrack.org/a/w7syl3vnjb ) and still qualify!
How Does the Transient Zones Insights Indicator Work on TradingView?
The Transient Zones Insights indicator leverages Pine Script to perform a thorough analysis of price movement. Here’s how it works:
- Left and Right Zone Sizes: The first step in the analysis is adjusting the left and right zone sizes. This defines the range from which the indicator will calculate the highest and lowest zones. Traders can customize these values to fit their trading strategy.
- Central Zone Analysis: Once the zone sizes are defined, the indicator analyzes the central bar. It checks whether this central bar is the highest or lowest point within the defined range. If the central bar is the highest point, it may signal a potential resistance area, while if it’s the lowest, it may indicate a potential support zone.
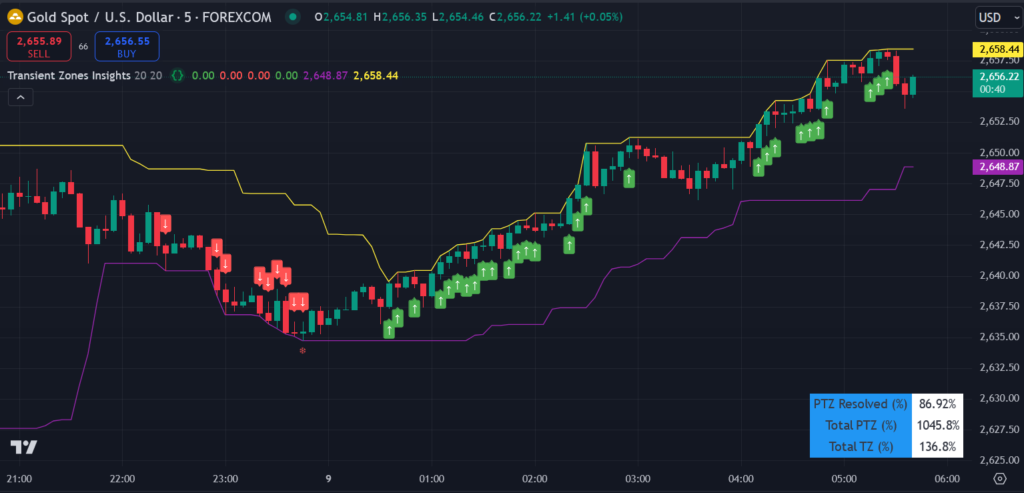
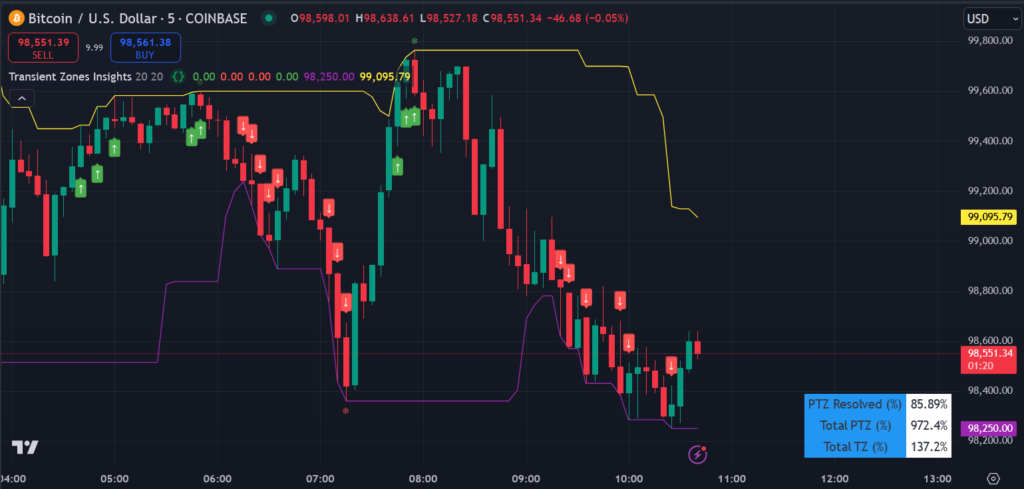
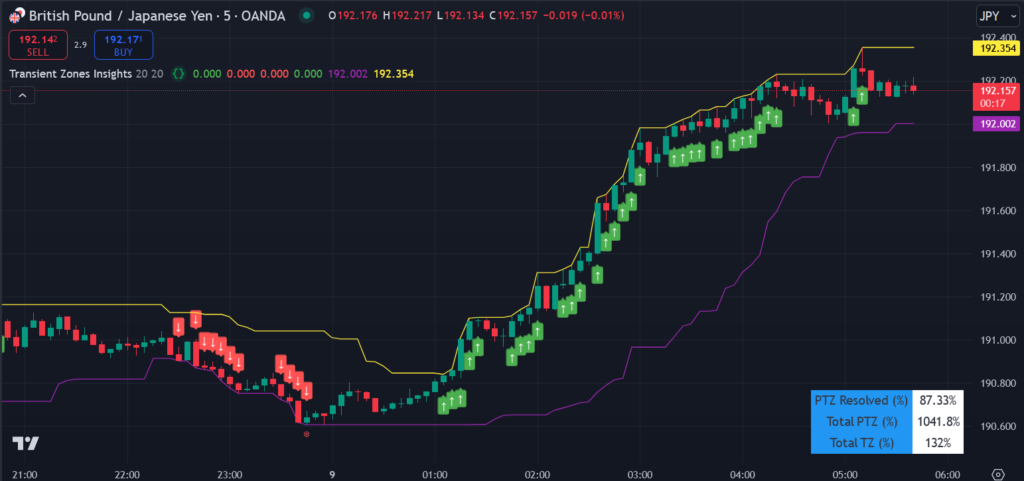
- Zone Boundary Markers: The indicator plots shapes around these identified zones to visually mark the boundaries where potential price reversals could happen. These markers act as cues for traders to pay attention to these specific price levels, making it easier to spot trends and reversals.
- Probability Stats: One of the standout features of the Transient Zones Insights indicator is the inclusion of probability statistics. The indicator displays the percentage of resolved Price Transient Zones (PTZ), the total PTZs identified, and the current TZs over a specified sampling period. These statistics give traders an understanding of how likely it is that the zone will resolve, helping them gauge market conditions and make more informed decisions.
Features of the Transient Zones Insights Indicator
The Transient Zones Insights indicator comes with several key features that make it a valuable tool for traders on TradingView:
- Adjustable Left and Right Zone Sizes: This feature allows traders to define their preferred range for evaluating high and low zones. Customizing this range helps fit the indicator to various trading strategies.
- Central Zone Analysis for Trend Reversal: By analyzing the central bar, the indicator detects potential price reversal zones, helping traders identify critical points for entering or exiting trades.
- Visual Zone Markers: The indicator plots shapes that mark potential price reversal points at the zone boundaries, making it easy for traders to visually spot key levels of interest.
- Detailed Probability Stats: With a table displaying statistical data on resolved and unresolved transient zones, traders gain insights into the likelihood of a zone being resolved. This provides additional context to help improve decision-making.
How the Transient Zones Insights Indicator Can Help Traders
1. Trend Reversal Signals
One of the primary functions of the Transient Zones Insights indicator is to help identify potential trend reversals. By highlighting central zones with significant highs or lows, the indicator signals when the market might be preparing for a change in direction. These signals can be crucial for traders looking to enter a position before a trend reversal takes place, giving them an edge in the market.
2. Strategic Entry Points
The shapes and zone markers plotted by the indicator provide visual cues that can serve as strategic entry points. When price approaches a marked transient zone boundary, traders can anticipate potential breakout or breakdown scenarios. By acting on these visual markers, traders can plan their entries more effectively, either to go long or short based on the expected price movement.
3. Statistical Insights for Better Decision-Making
The inclusion of probability stats adds a layer of sophistication to the analysis. Traders can assess the likelihood of a transient zone resolving in a particular direction, helping them understand market conditions more deeply. This statistical information enables traders to refine their strategies and make data-driven decisions, improving their overall trading accuracy.
4. Risk Management
By identifying potential reversal points and providing strategic entry signals, the Transient Zones Insights indicator helps traders manage risk. With a clearer understanding of where the market might reverse, traders can set stop-loss levels more effectively, minimizing the risk of large losses.
Why Use the Transient Zones Insights Indicator on TradingView?
- Customizable and Flexible: With adjustable left and right zone sizes, the indicator can be tailored to suit various trading styles and timeframes. This customization ensures that it can be used by both short-term and long-term traders.
- Advanced Analysis: By focusing on central zone analysis and boundary markers, the indicator offers a more advanced method of identifying potential price reversal zones compared to traditional methods like support and resistance lines.
- Increased Precision: The use of probability statistics adds a layer of precision to the analysis, helping traders understand the likelihood of a zone resolving in a particular direction.
- Ease of Use: Despite its advanced features, the indicator is easy to use on TradingView. The visual markers and probability stats make it intuitive for traders to identify important price levels without getting overwhelmed.
Conclusion
The Transient Zones Insights indicator is an invaluable tool for traders using TradingView. It helps identify critical price zones where reversals are likely to occur, enabling traders to make better-informed decisions. By leveraging Pine Script, the indicator provides customizable zone sizes, central zone analysis, visual markers, and statistical insights, all of which contribute to a deeper understanding of market dynamics. Whether you’re a beginner or an experienced trader, incorporating this indicator into your strategy can help you stay ahead of the market, spot trend reversals, and manage risk more effectively.
Pinescript of Transient Zones Insights TradingView Indicator
For access to this indicator, reach out to us at +91 7620658346. We specialize in developing algorithms for TradingView, MT4/MT5, and trading bots.
Follow @algo_aakash on Instagram, YouTube, and Twitter for updates
Disclaimer
The information in this article and any related indicators is for educational purposes only. Trading in financial markets carries substantial risk, and there is no guarantee of profit. The custom Bollinger Band strategy is based on historical data and technical analysis, which may not accurately predict future market movements. Users should conduct their own research, assess their risk tolerance, and consult with a licensed financial advisor before making any trading decisions. The author and developer of this indicator are not responsible for any losses incurred through the use of this strategy. Please trade responsibly.
🔓 Get This Tool for FREE!
- ✅ Click here to open a trading account using our referral link and start trading.
- 💡 Use coupon code: FREE during checkout.
- 📅 After 7 days of active trading under our referral link, you’ll get access to this tool in your account.
- ⚠️ Keep trading to keep access free — if you're inactive for 7 days, your access will be removed.
- 👉 Already have an account? You can change the IB (introducing broker) to our referral link and still qualify!

0 Comments