🔓 Get All Tools for FREE!
- ✅ Click here to open a trading account using our referral link and start trading.
- 📅 After 7 days of active trading under our referral link, you can get access to all tools in your account.
- ⚠️ Keep trading to keep access free — if you're inactive for 7 days, your access will be removed.
- 👉 Already have an account? You can change the IB (introducing broker) to our referral link ( https://one.exnesstrack.org/a/w7syl3vnjb ) and still qualify!
Trading can be overwhelming, with the constant pressure to make the right decision at the right time. To make life easier for traders, we’ve designed a powerful tool: the Trendline Breakout + Support Resistance Retest Indicator. Whether you’re trading Forex, stocks, or crypto, this indicator combines two of the most reliable price action strategies—trendline breakouts and support-resistance retests—giving you high-quality trading signals that are easy to follow.
In this post, we’ll break down exactly how this indicator works, why it’s so effective, and how you can use it to take your trading game to the next level. Ready to start trading smarter, not harder? Let’s dive in!
🔓 Get All Tools for FREE!
- ✅ Click here to open a trading account using our referral link and start trading.
- 📅 After 7 days of active trading under our referral link, you can get access to all tools in your account.
- ⚠️ Keep trading to keep access free — if you're inactive for 7 days, your access will be removed.
- 👉 Already have an account? You can change the IB (introducing broker) to our referral link ( https://one.exnesstrack.org/a/w7syl3vnjb ) and still qualify!
What is the Trendline Breakout + Support Resistance Retest Indicator?
The Trendline Breakout + Support Resistance Retest Indicator is an advanced price action trading tool that helps traders identify significant market movements. It focuses on two key strategies: trendline breakouts and support-resistance retests. These are classic trading concepts that, when combined, offer a reliable method to catch both trend continuations and reversals.
Let’s break it down further:
- Trendline Breakout: Trendlines are used to identify price trends by connecting highs in a downtrend or lows in an uptrend. When the price breaks through these lines, it indicates a potential shift in the trend direction.
- Support-Resistance Retest: Support and resistance levels are crucial price points where the market tends to react. A support level represents a price point where the asset has difficulty falling below, while a resistance level is where the asset has difficulty rising above. When the price retests these levels after a breakout, it’s often an opportunity to confirm the trend shift before entering the trade.
The indicator takes these two concepts and automates them, giving you real-time signals for both buy and sell opportunities. On the buy side, it identifies when the price breaks a trendline to the upside and retests the last swing low’s support level, providing confirmation to enter the trade. On the sell side, it looks for a breakdown of the trendline and retests the previous swing high’s resistance level for a potential short trade.

Why Is This Indicator So Effective?
Now that you understand the basics, let’s explore why this indicator is such a game-changer for traders. Here are three reasons why it works so well:
- Combines Two Powerful Strategies:
Individually, trendline breakouts and support-resistance retests are already effective strategies. But when you combine them, they provide a more robust framework for making trading decisions. The trendline breakout signals the potential for a new trend, while the retest of support or resistance confirms it, giving you more confidence to enter the trade. - Eliminates Guesswork:
One of the biggest challenges traders face is deciding when to enter a trade. This indicator takes out the guesswork by automatically identifying key breakout points and retest levels, allowing you to focus on execution rather than analysis. - Improves Risk Management:
Trading without a clear signal can lead to emotional decisions and poor risk management. By relying on this indicator’s signals, you can plan your trades with more precision, knowing exactly where to set your stop-losses and take-profits based on the breakout and retest zones.
How Does the Trendline Breakout + Support Resistance Retest Indicator Work?
Let’s get into the technical details of how this indicator operates within TradingView, one of the most popular charting platforms for traders worldwide.
Step-by-Step Guide to Using the Indicator in TradingView:
- Add the Indicator to Your Chart:
Once you’ve downloaded the Trendline Breakout + Support Resistance Retest Indicator, add it to your TradingView chart just like any other indicator. - Draw the Trendlines:
Identify key levels where the price has consistently respected a trendline. For an uptrend, you’d draw the line by connecting swing lows, and for a downtrend, by connecting swing highs. - Look for Breakouts:
The indicator automatically detects when the price breaks through the trendline. For a buy signal, the price needs to break the upper trendline. For a sell signal, it should break below the lower trendline. - Wait for the Retest:
After the breakout, the price often pulls back to retest the previous support or resistance level. The indicator alerts you when this happens, confirming whether it’s a valid breakout or just a false move. - Enter the Trade:
Once the price retests the support (for buys) or resistance (for sells), you’ll receive a signal to enter the trade. The indicator will also suggest areas where you can set your stop-loss to manage risk effectively. - Manage the Trade:
Keep an eye on the price action after the entry. As long as the price stays above the retested support (or below resistance for sells), you can ride the trade for further gains. Consider setting take-profit levels at previous highs or lows for optimal exits.
Key Features of the Indicator
- Real-Time Alerts:
The indicator provides real-time alerts, so you don’t have to be glued to your screen. As soon as a breakout and retest occur, you’ll be notified via pop-ups, email, or mobile notifications, depending on your preferences. - Customizable Settings:
You can customize the sensitivity of the trendline breakouts and retests, allowing you to fine-tune the indicator to match your trading style—whether you’re a day trader, swing trader, or long-term investor. - Multi-Timeframe Compatibility:
This indicator works across all timeframes, from the 1-minute chart for scalpers to the daily and weekly charts for long-term traders. No matter your trading style, you can use this indicator to find opportunities. - Backtesting Capabilities:
One of the best features of TradingView is the ability to backtest your strategies. With this indicator, you can easily test how well it would have performed in the past by applying it to historical data and analyzing the results.
How to Maximize Your Trading with This Indicator
Here are some additional tips to help you get the most out of the Trendline Breakout + Support Resistance Retest Indicator:
- Combine with Other Indicators: While this indicator is powerful on its own, it works even better when combined with other tools like moving averages, oscillators, or volume-based indicators. These can help confirm the strength of the trend before entering a trade.
- Use Proper Risk Management: Never risk more than 1-2% of your trading account on a single trade. Set your stop-losses at logical levels, and always follow your trading plan.
- Stay Patient: Not every breakout will lead to a successful trade, but by waiting for the retest and confirmation, you can significantly improve your odds. Stay disciplined and follow the indicator’s signals for the best results.

Contact us at +91 7620658346 for access to this indicator. We offer algo development for TradingView indicators, MT4/MT5, and trading bots. Follow us on Instagram, YouTube, and Twitter @algo_aakash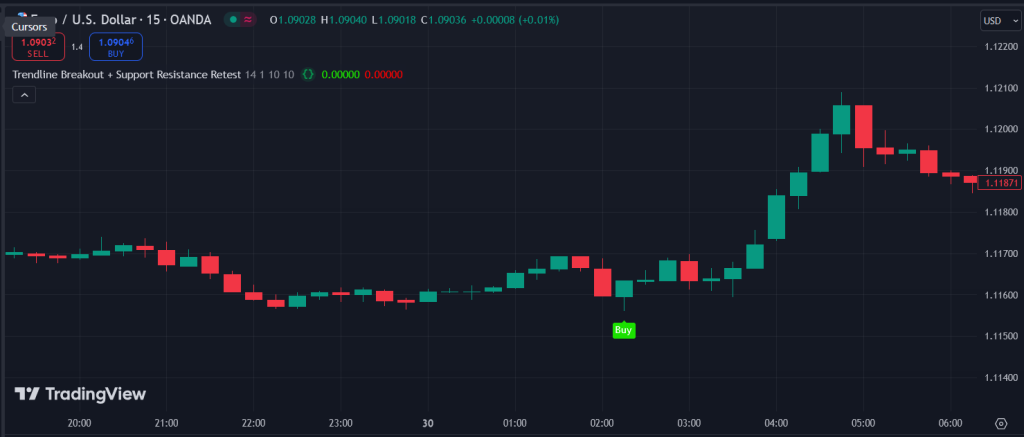
Conclusion: A Must-Have Tool for Price Action Traders
The Trendline Breakout + Support Resistance Retest Indicator is a powerful tool for any trader looking to capitalize on price action strategies. By automating the process of identifying trendline breakouts and retests, it helps you make better, faster decisions while minimizing risk. Whether you’re a seasoned trader or just getting started, this indicator can help you achieve more consistent trading success.
Disclaimer:
The information provided in this video and accompanying content is for educational and informational purposes only. It is not financial or trading advice, nor should it be considered as such. Trading financial instruments such as stocks, Forex, cryptocurrencies, and other assets involves significant risk and can result in the loss of capital. Always conduct your own research, perform thorough analysis, and consult with a licensed financial advisor before making any trading decisions. Past performance is not indicative of future results. The use of any indicator, including the Trendline Breakout + Support Resistance Retest Indicator, does not guarantee success or profit. Trade responsibly.
0 Comments