🔓 Get All Tools for FREE!
- ✅ Click here to open a trading account using our referral link and start trading.
- 📅 After 7 days of active trading under our referral link, you can get access to all tools in your account.
- ⚠️ Keep trading to keep access free — if you're inactive for 7 days, your access will be removed.
- 👉 Already have an account? You can change the IB (introducing broker) to our referral link ( https://one.exnesstrack.org/a/w7syl3vnjb ) and still qualify!
In the fast-paced world of trading, being able to identify key levels of support and resistance quickly is a critical skill. The Support and Resistance Breakout Indicator for TradingView offers a powerful tool for traders looking to capitalize on these key price levels. This indicator automatically detects important support and resistance zones on the chart and alerts traders when price breaks through these levels. With its unique algorithm, this indicator can be a game-changer for both beginners and experienced traders looking to refine their trading strategy.
What is the Support and Resistance Breakout Indicator?
The Support and Resistance Breakout Indicator is a sophisticated tool designed for traders using the TradingView platform. It identifies major support and resistance levels on a 5-minute chart, two critical areas where price tends to stall or reverse. Support represents a level where the price tends to find buying interest, preventing it from falling further. Resistance, on the other hand, represents a level where selling pressure is strong enough to halt the price from rising higher.
🔓 Get All Tools for FREE!
- ✅ Click here to open a trading account using our referral link and start trading.
- 📅 After 7 days of active trading under our referral link, you can get access to all tools in your account.
- ⚠️ Keep trading to keep access free — if you're inactive for 7 days, your access will be removed.
- 👉 Already have an account? You can change the IB (introducing broker) to our referral link ( https://one.exnesstrack.org/a/w7syl3vnjb ) and still qualify!
This indicator works by monitoring the price action near these levels. It does not merely identify these levels but also looks for consolidation patterns around them. Consolidation refers to a period where price moves sideways within a range, suggesting indecision between buyers and sellers. This can be a precursor to a breakout, where the price either breaks above resistance or falls below support. The indicator triggers buy and sell signals based on this price action, allowing traders to take advantage of potential breakout trades.
How Does the Indicator Work?
The core concept behind the Support and Resistance Breakout Indicator is price action and breakout confirmation. It follows a simple but effective approach to trading breakouts:
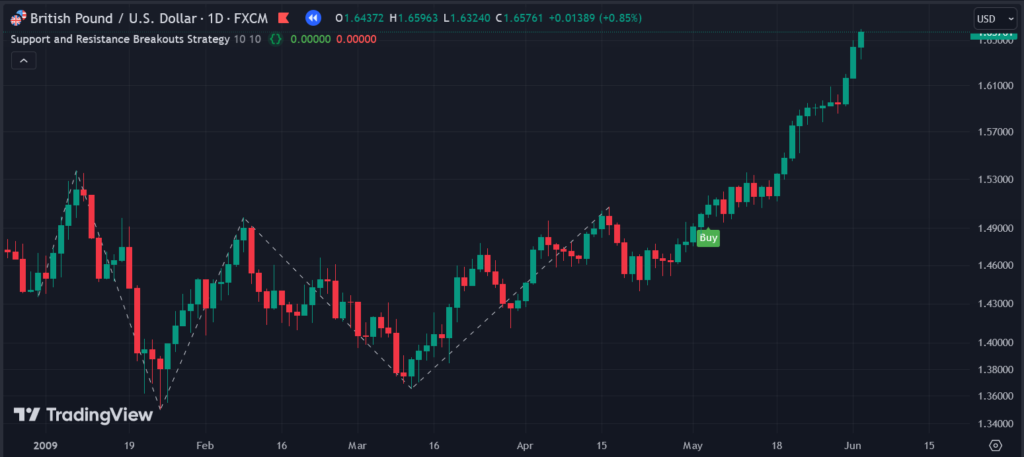
Buy Signal
A buy signal is generated when the price tests a resistance level three times, consolidates just below it for 10-15 minutes, and then breaks above it. This pattern suggests that sellers are losing control, and the price might continue its upward momentum. The consolidation phase acts as a “spring” that gathers energy for the breakout.
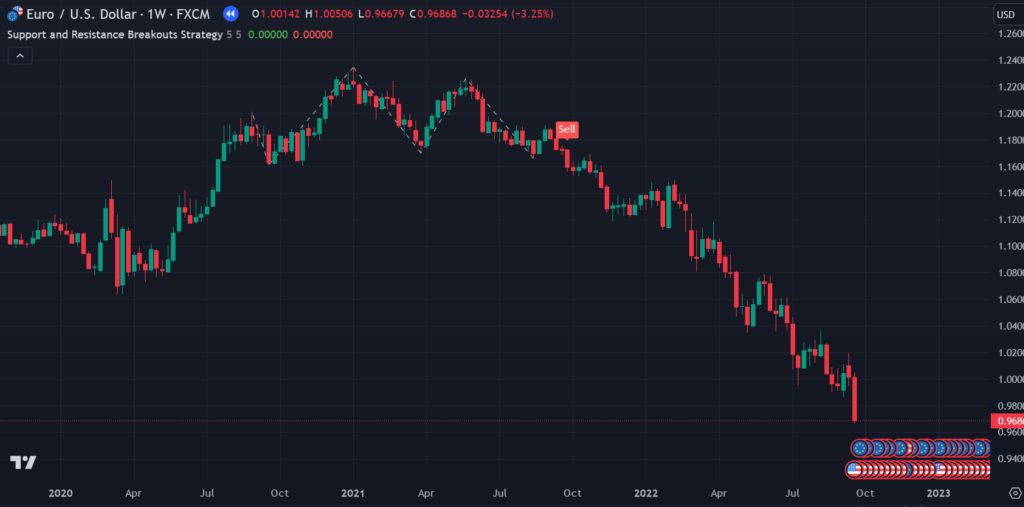
Sell Signal
A sell signal is triggered when the price tests support three times, consolidates above it, and then breaks below it. This pattern indicates that buyers are losing control, and the price could continue its downward movement. The consolidation phase above support can be seen as a sign that the price is preparing for a reversal.
Both buy and sell signals are based on the understanding that multiple tests of support or resistance often indicate a weakening of the current trend. A breakout from these levels is seen as a potential confirmation of the next price move.
How Does It Work in TradingView?
The Support and Resistance Breakout Indicator can be easily applied to any chart on TradingView. Below are the step-by-step instructions on how to use this indicator effectively:
- Add the Indicator to Your TradingView Chart
- To begin, search for the Support and Resistance Breakout Indicator within TradingView’s public library of indicators. Once found, simply add it to your chart.
- This will automatically plot the major support and resistance zones on your 5-minute chart.
- Automatic Detection of Support and Resistance Levels
- The indicator uses advanced algorithms to detect significant support and resistance levels based on recent price action.
- The levels are clearly displayed on your chart, making it easy to spot the key zones without manually drawing them.
- Buy Signal
- The indicator will give a buy signal when the price breaks through resistance after consolidating below it for some time. This is considered a bullish breakout, and the indicator will notify you with a clear alert, ensuring you don’t miss the opportunity.
- The consolidation phase before the breakout indicates a buildup of pressure, making the breakout more likely to lead to sustained upward movement.
- Sell Signal
- Similarly, a sell signal is triggered when the price breaks through support after consolidating above it. This is a bearish breakout, and the indicator will automatically alert you when the price breaks down below the support level.
- The consolidation above support suggests that the price is preparing for a downward move, and the breakout below it confirms the bearish trend.
- Automatic Alerts
- One of the most powerful features of this indicator is the automatic alert system. You will receive notifications via TradingView when a breakout happens, keeping you informed even if you are not actively watching the charts.
- These alerts can be customized based on your trading preferences, allowing you to set up notifications for both buy and sell signals.
Why Use the Support and Resistance Breakout Indicator?
There are several reasons why the Support and Resistance Breakout Indicator can be an invaluable tool for traders:
- Time-Saving
- By automatically identifying key support and resistance zones and alerting you to breakouts, the indicator saves you time. You no longer need to manually draw support and resistance lines or constantly monitor the charts.
- Improved Decision-Making
- The indicator provides clear buy and sell signals based on well-established price action patterns. This helps you make faster and more informed trading decisions, potentially improving your overall trading performance.
- Accuracy
- Breakouts often lead to strong price moves, making them high-probability trade setups. This indicator helps you identify these breakouts with greater accuracy, increasing the likelihood of profitable trades.
- Free and Accessible
- One of the best parts of this tool is that it is completely free. Aakash, the creator of this indicator, has built over 500 algorithms for clients worldwide and made this tool accessible to the public at no charge. This gives traders of all levels the chance to use a premium-quality tool without any financial commitment.
Contact us at +91 7620658346 for access to this indicator. We offer algo development for TradingView indicators, MT4/MT5, and trading bots.
Follow us on Instagram, YouTube, and Twitter @algo_aakash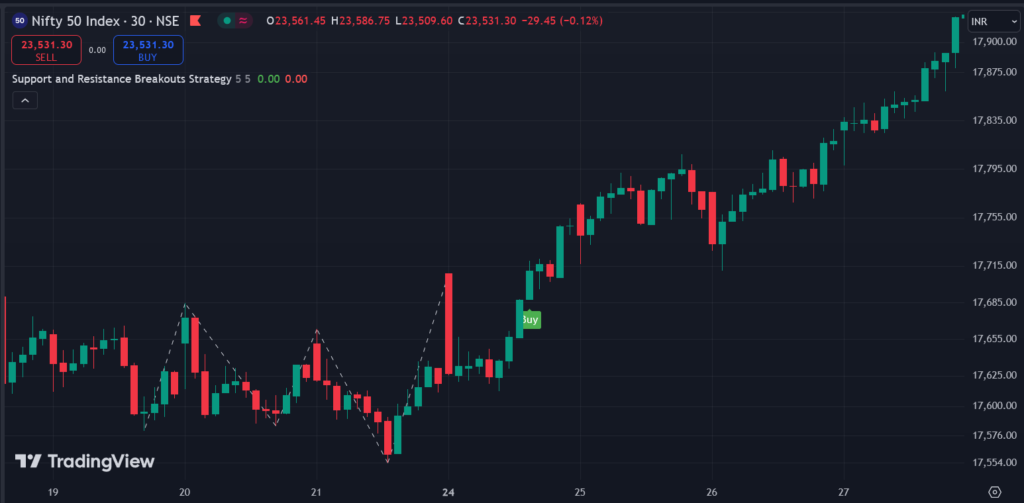
Conclusion
The Support and Resistance Breakout Indicator is a powerful tool for any trader looking to capitalize on price action near key levels. By detecting breakouts from well-tested support and resistance zones, this indicator helps you identify high-probability trades with automatic alerts to ensure you never miss an opportunity. Whether you’re a beginner or an experienced trader, this tool can enhance your trading strategy by providing timely and accurate signals. With its free access, you can get started today and begin incorporating this game-changing indicator into your trading toolkit.
Disclaimer:
The information provided in this content, including the use of the Support and Resistance Breakout Indicator, is for educational and informational purposes only. Trading involves significant risk, and there is a possibility of losing capital. This indicator does not guarantee profits and should not be considered as financial advice. Past performance is not indicative of future results. Before using any trading tools or strategies, ensure you fully understand the risks involved, and consider consulting with a qualified financial advisor. The creator of this tool, Aakash, is not responsible for any losses or damages resulting from the use of this indicator or any trading decisions made based on its signals.
0 Comments