🔓 Get All Tools for FREE!
- ✅ Click here to open a trading account using our referral link and start trading.
- 📅 After 7 days of active trading under our referral link, you can get access to all tools in your account.
- ⚠️ Keep trading to keep access free — if you're inactive for 7 days, your access will be removed.
- 👉 Already have an account? You can change the IB (introducing broker) to our referral link ( https://one.exnesstrack.org/a/w7syl3vnjb ) and still qualify!
In the fast-paced world of trading, timing and precision are everything. As a trader, identifying key market zones where price reversals or strong continuation moves are likely can give you a significant edge. That’s exactly what the Supply-Demand Master TradingView indicator aims to achieve. By automatically detecting crucial supply and demand zones using well-known price patterns, it takes the guesswork out of the equation, allowing you to focus on your trade decisions.
In this comprehensive guide, we’ll explore what this powerful indicator does, how it works, and how you can leverage it to make smarter trading choices. Plus, we’ll break down some key concepts to help you get started right away!
🔓 Get All Tools for FREE!
- ✅ Click here to open a trading account using our referral link and start trading.
- 📅 After 7 days of active trading under our referral link, you can get access to all tools in your account.
- ⚠️ Keep trading to keep access free — if you're inactive for 7 days, your access will be removed.
- 👉 Already have an account? You can change the IB (introducing broker) to our referral link ( https://one.exnesstrack.org/a/w7syl3vnjb ) and still qualify!
What is the Supply-Demand Master Indicator?
The Supply-Demand Master is an innovative custom indicator built for TradingView, designed to detect supply and demand zones with accuracy. For those unfamiliar, supply zones refer to areas where sellers have historically outnumbered buyers, causing price to fall, while demand zones are areas where buyers have been stronger than sellers, pushing the price up.
But manually identifying these zones can be challenging, time-consuming, and often subjective. That’s where the Supply-Demand Master indicator comes in. It automates this entire process by detecting well-known patterns such as Rally-Base-Rally (RBR), Drop-Base-Drop (DBD), Rally-Base-Drop (RBD), and Drop-Base-Rally (DBR). These price patterns are based on how the market transitions between periods of strong buying or selling momentum, followed by a pause (base), and then a continuation or reversal.
The real power of this indicator lies in its ability to give traders precise entry and exit points without the need for manual drawing or interpretation of these zones. This saves traders a lot of time and reduces the chances of missing out on potential setups.
How Does the Supply-Demand Master Work?
Let’s dive into how the Supply-Demand Master detects the four primary price patterns and how you can use them in your trading strategy:
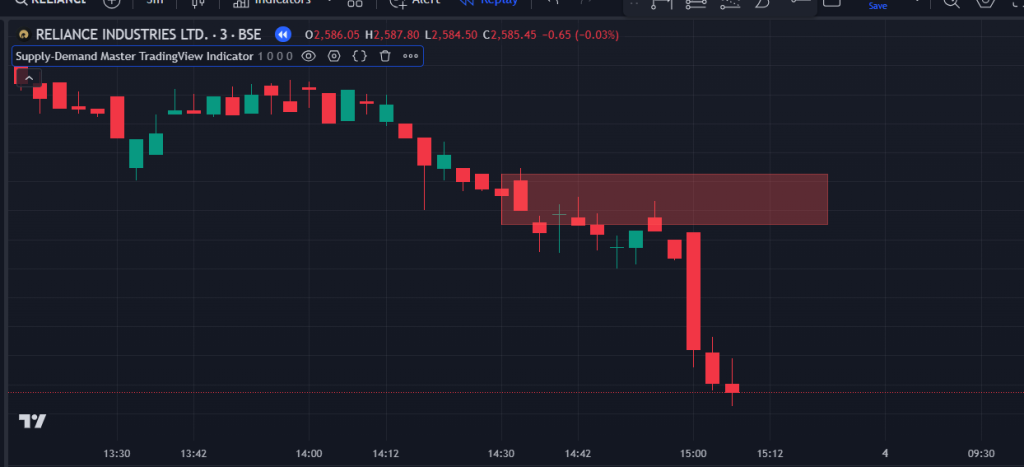
- Drop-Base-Drop (DBD):
- The DBD pattern is formed when the price drops, forms a consolidation or base, and then drops again. This signals a strong resistance zone, where sellers have taken control of the market, and the price is likely to drop again if it revisits this zone.
- In practical terms, when the Supply-Demand Master identifies this pattern, it highlights a resistance zone where you might consider shorting or exiting long positions when the price approaches.
- Rally-Base-Rally (RBR):
- The RBR pattern happens when the price rallies, consolidates for a brief period (forming a base), and then rallies again. This signals a support zone, where buyers are likely to step in if the price revisits this area.
- When this pattern is detected, the indicator marks a support zone, indicating a potential buying opportunity or an area to add to long positions if the price pulls back to this zone.
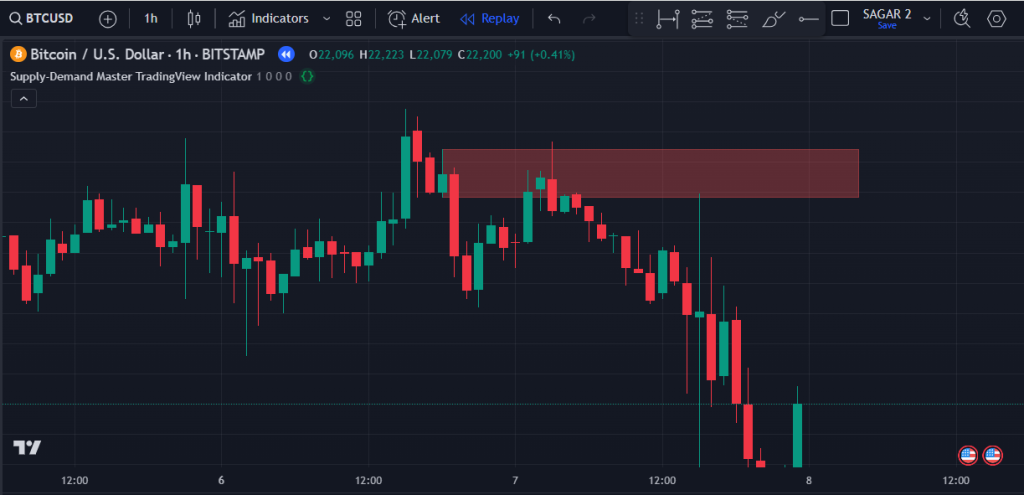
- Rally-Base-Drop (RBD):
- The RBD pattern occurs when the price rallies, forms a base, and then drops. This indicates a potential resistance zone, where the market is showing signs of reversal from a bullish trend to a bearish one.
- The indicator will highlight this area as a potential sell zone or a place where traders might want to consider taking profits on long positions or initiating short positions.
- Drop-Base-Rally (DBR):
- The DBR pattern is formed when the price drops, consolidates, and then rallies. This pattern highlights a demand zone, where buyers have stepped in, and the price is likely to rise if it revisits this area.
- The indicator marks this area as a support zone, signaling potential buy opportunities if the price returns to this zone.
Why the Supply-Demand Master Indicator Matters in Trading
Supply and demand zones are critical because they represent areas where the market has historically shifted between buying and selling pressure. By using these zones, traders can make better-informed decisions about potential entry and exit points.
Here are some key reasons why the Supply-Demand Master indicator stands out:
- Time-Saving: No need to manually draw supply and demand zones or rely on subjective judgment. The indicator does it for you, consistently and accurately.
- Clear Entry and Exit Points: By highlighting supply and demand zones, the indicator shows you exactly where to consider placing buy or sell orders.
- Versatile Application: The indicator works across different timeframes, from scalping on lower timeframes to swing trading or long-term investment decisions.
- Increased Confidence: Automated zone detection reduces the chances of missing out on potential trade setups, helping you trade with more confidence.
How to Use the Supply-Demand Master Indicator in Your Trading Strategy
Here’s how you can incorporate the Supply-Demand Master into your trading routine for optimal results:
- Set the Right Timeframe:
Depending on whether you’re a scalper, swing trader, or long-term investor, the timeframe you use will vary. Higher timeframes like daily or weekly charts provide more significant supply-demand zones, while lower timeframes like 1-minute or 5-minute charts can help scalpers spot intraday zones. - Identify Supply and Demand Zones:
Once the indicator highlights the zones, pay close attention to the price action when the market approaches these areas. You can place limit orders at these levels to enter trades as the price reaches the zone or wait for additional confirmation (like candlestick patterns or volume spikes) before making your move. - Use Additional Indicators for Confirmation:
While the Supply-Demand Master is powerful on its own, combining it with other indicators like RSI, MACD, or moving averages can give you extra confidence. For example, if the RSI shows the market is oversold near a demand zone, it could signal a strong buy opportunity. - Set Proper Stop-Losses and Take-Profits:
Even with well-defined zones, there’s always a chance the market will break through them. Set your stop-loss just beyond the supply or demand zone to protect your capital. Similarly, set your take-profit target based on nearby resistance or support levels. - Backtest Your Strategy:
Use TradingView’s backtesting feature to test how well the Supply-Demand Master works with your preferred strategy. This will give you a sense of its historical accuracy and potential profitability.
Contact us at +91 7620658346 for access to this indicator. We offer algo development for TradingView indicators, MT4/MT5, and trading bots. Follow us on Instagram, YouTube, and Twitter @algo_aakash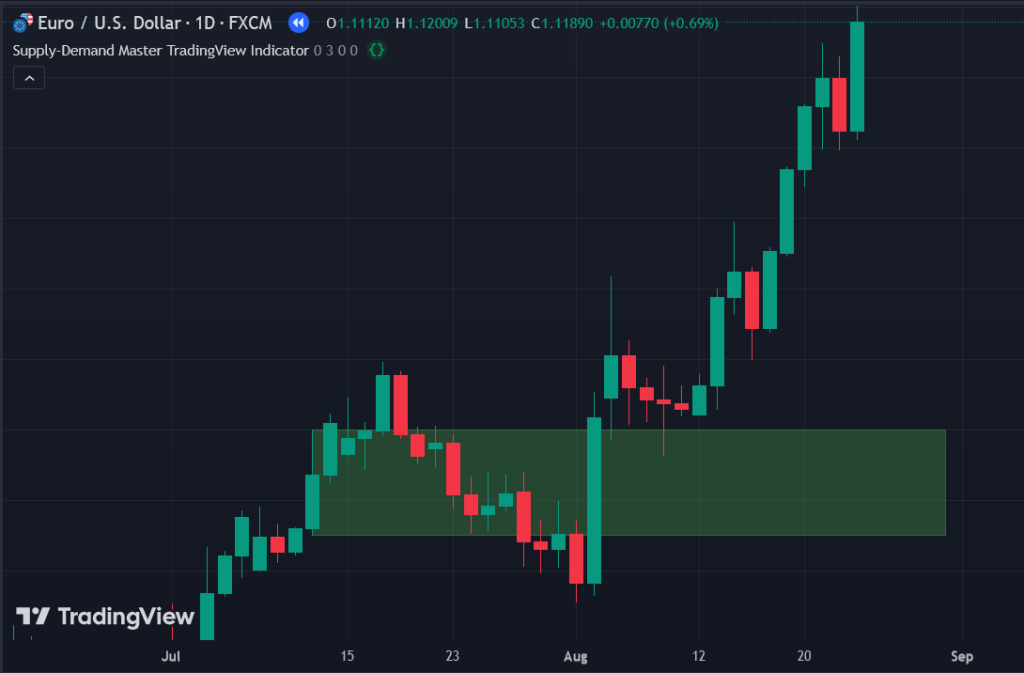
Conclusion
The Supply-Demand Master TradingView indicator is a game-changer for traders looking to automate the process of identifying critical supply and demand zones. Whether you’re a beginner or an experienced trader, this indicator can significantly simplify your analysis, helping you spot key reversal points, plan your entries and exits, and ultimately make better trading decisions.
Disclaimer:
The information provided in this content, including the description and functionality of the Supply-Demand Master TradingView indicator, is for educational and informational purposes only. It is not intended as financial advice, and you should not consider it as such. Trading in financial markets involves a high level of risk and may not be suitable for all investors. Past performance is not indicative of future results. Always do your own research, and consult with a qualified financial advisor before making any trading decisions. The use of any indicators or strategies mentioned in this content is at your own risk.
0 Comments