🔓 Get All Tools for FREE!
- ✅ Click here to open a trading account using our referral link and start trading.
- 📅 After 7 days of active trading under our referral link, you can get access to all tools in your account.
- ⚠️ Keep trading to keep access free — if you're inactive for 7 days, your access will be removed.
- 👉 Already have an account? You can change the IB (introducing broker) to our referral link ( https://one.exnesstrack.org/a/w7syl3vnjb ) and still qualify!
In the dynamic world of trading, having the right tools can make all the difference between success and failure. One such powerful tool is the Stochastic RSI with Customized Indicator, a sophisticated combination of two popular technical indicators: the Stochastic Oscillator and the Relative Strength Index (RSI). This guide delves into how this innovative indicator works, its unique features, and how it can enhance your trading strategies.
What is the Stochastic RSI?
The Stochastic RSI is a momentum oscillator that measures the level of the RSI relative to its range over a specified period. By applying the Stochastic formula to the RSI values, traders gain insights into the momentum and potential reversal points of an asset. The Stochastic RSI indicator oscillates between 0 and 1 (or 0 to 100 when multiplied by 100), making it easier to interpret overbought or oversold conditions.
Key Components:
- %K Line: Represents the current value of the Stochastic RSI.
- %D Line: A smoothed moving average of the %K line, typically calculated over a specified period.
How the Indicator Works
1. Input Parameters
The Stochastic RSI with Customized Indicator allows traders to tailor the indicator to their trading style. Key input parameters include:
🔓 Get All Tools for FREE!
- ✅ Click here to open a trading account using our referral link and start trading.
- 📅 After 7 days of active trading under our referral link, you can get access to all tools in your account.
- ⚠️ Keep trading to keep access free — if you're inactive for 7 days, your access will be removed.
- 👉 Already have an account? You can change the IB (introducing broker) to our referral link ( https://one.exnesstrack.org/a/w7syl3vnjb ) and still qualify!
- RSI Length: This defines the number of periods over which the RSI is calculated. A shorter length can lead to more frequent signals, while a longer length can smooth out volatility.
- Smoothing Settings: Users can adjust the smoothing periods for both the %K and %D lines, enabling them to refine the signals based on market conditions and their risk tolerance.
2. Signal Calculation
Once the parameters are set, the indicator computes the Stochastic RSI values in real-time. The indicator identifies potential buy and sell signals based on:
- Oversold Condition: Typically, an RSI value below 30 indicates that an asset may be oversold. When the Stochastic RSI crosses above this level, it could signal a buying opportunity.
- Overbought Condition: Conversely, an RSI value above 70 suggests that an asset may be overbought. A downward cross of the Stochastic RSI below this level can indicate a potential selling opportunity.
3. Visual Signals
To simplify decision-making, the Stochastic RSI with Customized Indicator provides clear visual cues on the chart:
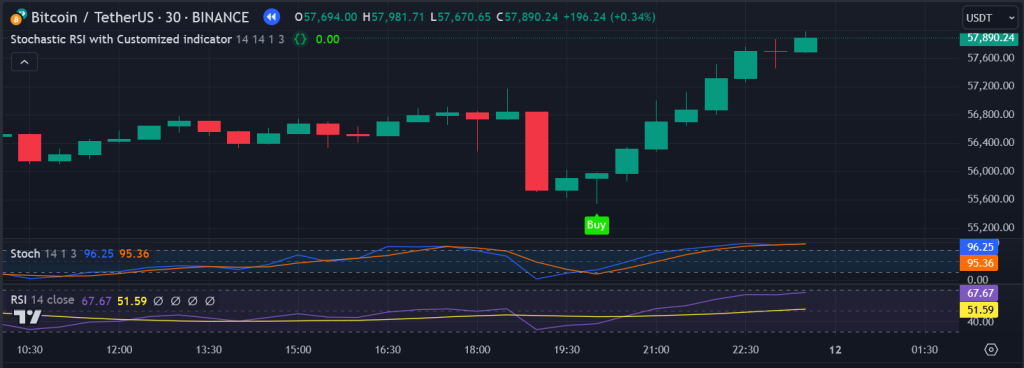
- Buy Signals: Represented as green labels appearing below the price bars when the indicator indicates oversold conditions and the %K line crosses above the %D line.
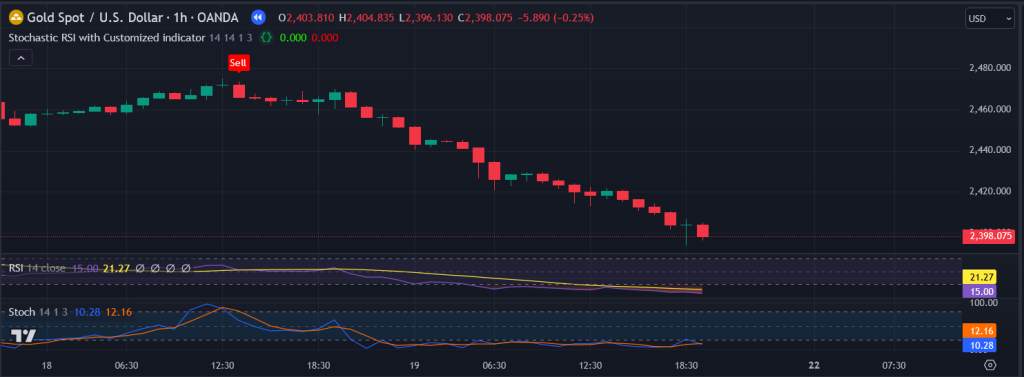
- Sell Signals: Shown as red labels above the price bars when overbought conditions are detected and the %K line crosses below the %D line.
These visual signals make it easy for traders to spot potential trading opportunities at a glance.
4. Dynamic Updates
One of the standout features of the Stochastic RSI with Customized Indicator is its real-time updating capability. As market conditions change, the indicator continuously recalculates and adjusts, providing traders with up-to-date insights. This dynamic aspect is crucial for active traders who rely on timely information to make informed decisions.
5. Simple Execution
For traders, especially beginners, the simplicity of execution is vital. The Stochastic RSI with Customized Indicator is designed to be user-friendly, with intuitive signals that help traders quickly assess market conditions. The clear visual cues eliminate ambiguity, allowing for more confident trading decisions.
How to Use the Stochastic RSI with Customized Indicator in Your Trading Strategy
To effectively incorporate the Stochastic RSI with Customized Indicator into your trading strategy, consider the following tips:
1. Confirm with Other Indicators
While the Stochastic RSI provides valuable signals, it is essential to confirm these with other indicators or price action analysis. Combining it with moving averages, trend lines, or support and resistance levels can enhance the reliability of your trading signals.
2. Adapt to Market Conditions
Market conditions can vary significantly, so adjusting your input parameters based on the current volatility and price action is crucial. For instance, during trending markets, you may want to use a longer RSI length to avoid false signals, while shorter lengths can be beneficial in ranging markets.
3. Manage Risk
Always implement proper risk management practices. Set stop-loss orders to protect your capital in case the market moves against you. The Stochastic RSI can help identify entry points, but risk management is vital for long-term success.
4. Backtest Your Strategy
Before deploying the Stochastic RSI with Customized Indicator in live trading, backtesting your strategy using historical data can provide insights into its effectiveness. This process allows you to refine your approach and gain confidence in your trading decisions.
5. Stay Informed
Stay updated on market news and events that could impact price movements. Economic reports, geopolitical developments, and earnings announcements can all influence market behavior, making it essential to stay informed while using technical indicators.

Pinescript code of Stochastic RSI with Customized indicator

//@version=5
// insta id algo_aakash
indicator(title="Stochastic RSI with Customized indicator", overlay=true)

// Input parameters
rsiLength = input.int(14, title="RSI Length", minval=1)
periodK = input.int(14, title="%K Length", minval=1)
smoothK = input.int(1, title="%K Smoothing", minval=1)
periodD = input.int(3, title="%D Smoothing", minval=1)

// Calculate Stochastic and RSI
k = ta.sma(ta.stoch(close, high, low, periodK), smoothK)
d = ta.sma(k, periodD)
rsi_ = ta.rsi(close, rsiLength)

// Variables to track the last signal
var bool lastBuy = true
var bool lastSell = true

// Buy Signal
buySignal = rsi_ > 30 and k > 20 and (rsi_[1] < 30 or k[1] < 20) and lastSell
if (buySignal)
    lastBuy := true
    lastSell := false

// Sell Signal
sellSignal = rsi_ < 70 and k < 80 and (rsi_[1] > 70 or k[1] > 80) and lastBuy
if (sellSignal)
    lastSell := true
    lastBuy := false

// Plot Buy and Sell signals only if conditions are met
plotshape(buySignal, style=shape.labelup, location=location.belowbar, color=#1be100, size=size.tiny, title='Buy', text='Buy', textcolor=color.white)
plotshape(sellSignal, style=shape.labeldown, location=location.abovebar, color=#fc0000, size=size.tiny, title='Sell', text='Sell', textcolor=color.white)
Conclusion
The Stochastic RSI with Customized Indicator is a powerful tool for traders seeking to enhance their decision-making process. By combining the strengths of the Stochastic Oscillator and RSI, this indicator provides clear signals for potential buy and sell opportunities based on overbought and oversold conditions. With customizable input parameters, dynamic updates, and user-friendly visual signals, it is a valuable addition to any trader’s toolkit.
Disclaimer
Disclaimer: The content provided in this article is for informational purposes only and should not be construed as financial advice. Trading involves risk, and it is essential to conduct your own research and consult with a financial advisor before making any investment decisions. The author is not liable for any losses or damages that may arise from the use of this information.

0 Comments