🔓 Get All Tools for FREE!
- ✅ Click here to open a trading account using our referral link and start trading.
- 📅 After 7 days of active trading under our referral link, you can get access to all tools in your account.
- ⚠️ Keep trading to keep access free — if you're inactive for 7 days, your access will be removed.
- 👉 Already have an account? You can change the IB (introducing broker) to our referral link ( https://one.exnesstrack.org/a/w7syl3vnjb ) and still qualify!
In the fast-paced world of trading, traders are constantly looking for tools and indicators that can give them a competitive edge. One such powerful tool is the RSI Divergence Buy/Sell Indicator with an EMA Filter. Whether you’re a seasoned trader or a beginner, this indicator can help you identify potential turning points in the market, making it easier to capitalize on profitable opportunities. In this article, we’ll explore what the RSI Divergence Buy/Sell Indicator is, how it works, and how you can use it effectively on TradingView charts to improve your trading performance.
What is the RSI Divergence Buy/Sell Indicator with EMA Filter?
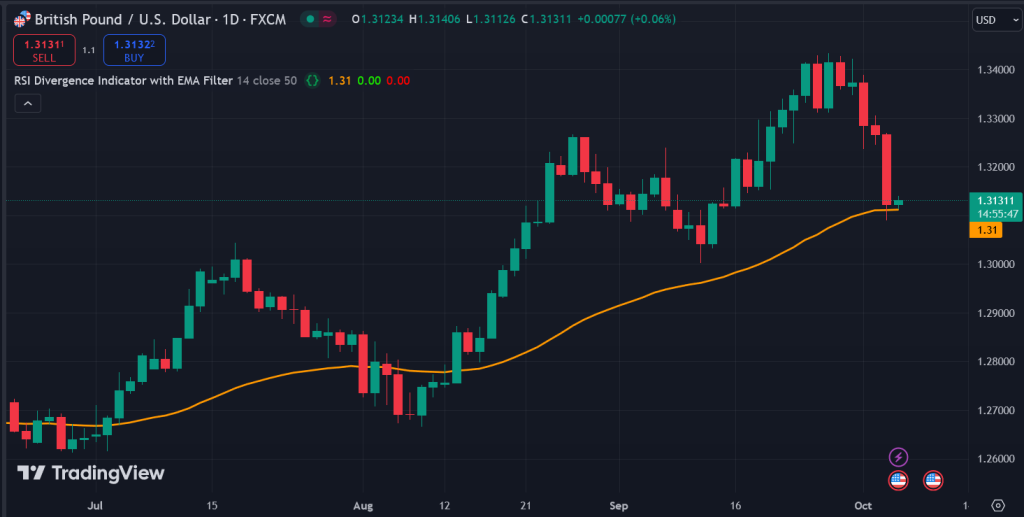
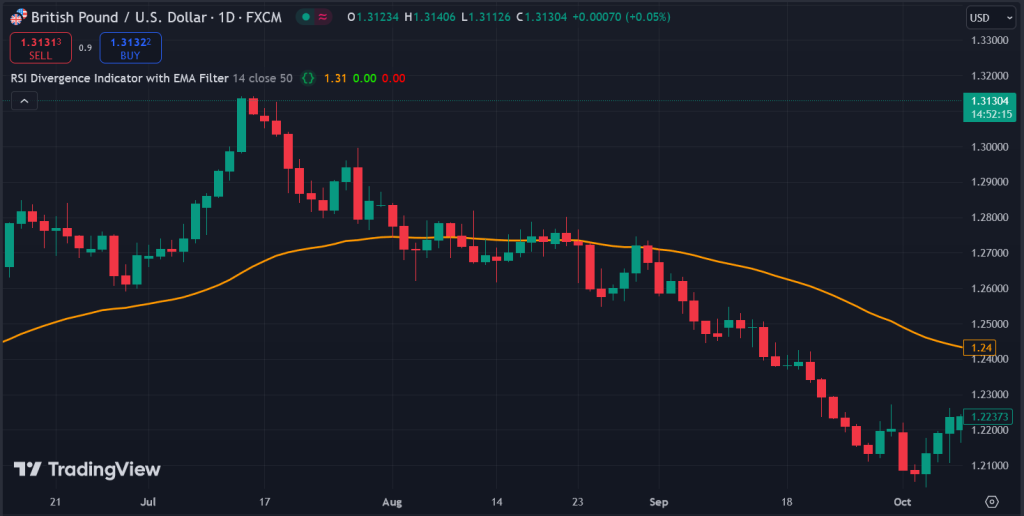
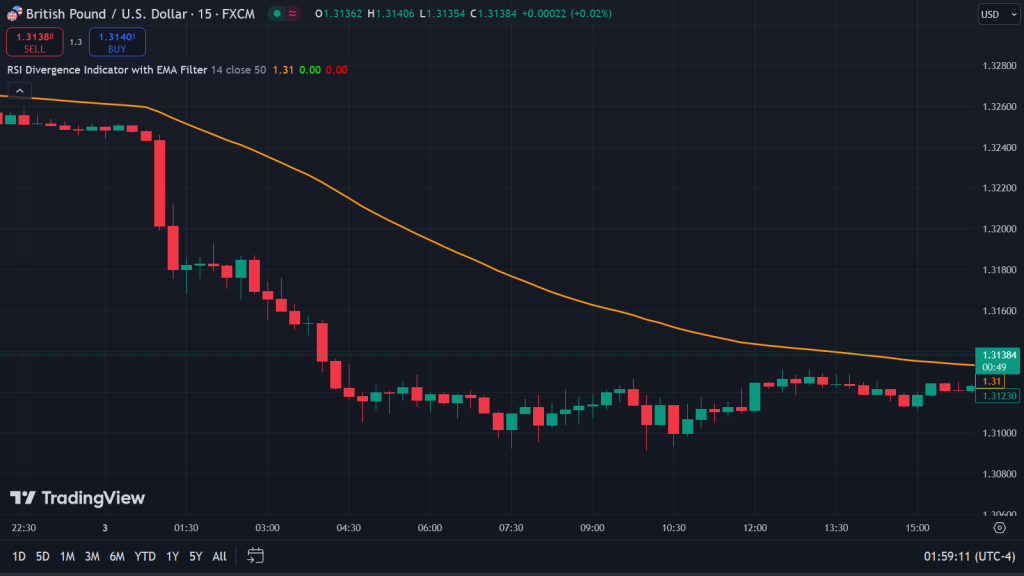
The RSI (Relative Strength Index) Divergence Buy/Sell Indicator with EMA Filter is a technical analysis tool designed to detect bullish and bearish divergences in the market. It works by comparing the movement of the asset’s price with the RSI, a popular momentum oscillator that measures the speed and change of price movements. When the price is moving in one direction but the RSI is moving in the opposite direction, this is known as a divergence.
Divergences are significant because they can signal a potential reversal in price. A bullish divergence occurs when the price is making lower lows while the RSI is making higher lows, indicating that downward momentum is weakening and the price may soon reverse upwards. Conversely, a bearish divergence happens when the price is making higher highs while the RSI is making lower highs, suggesting that upward momentum is fading, and a price drop may be imminent.
🔓 Get All Tools for FREE!
- ✅ Click here to open a trading account using our referral link and start trading.
- 📅 After 7 days of active trading under our referral link, you can get access to all tools in your account.
- ⚠️ Keep trading to keep access free — if you're inactive for 7 days, your access will be removed.
- 👉 Already have an account? You can change the IB (introducing broker) to our referral link ( https://one.exnesstrack.org/a/w7syl3vnjb ) and still qualify!
However, while divergences are powerful signals, they can sometimes lead to false alarms, especially in choppy markets. This is where the Exponential Moving Average (EMA) Filter comes into play. The EMA is a type of moving average that gives more weight to recent price data, making it more responsive to current market conditions. By using an EMA filter, the indicator confirms the validity of a divergence, helping traders filter out false signals and make more accurate trading decisions.
Why Use the RSI Divergence Buy/Sell Indicator?
The RSI Divergence Buy/Sell Indicator with EMA Filter offers several advantages that make it a valuable tool for traders:
- Automatic Divergence Detection: Manually spotting divergences can be time-consuming and prone to human error. This indicator automates the process, instantly highlighting bullish and bearish divergences on your chart.
- EMA Confirmation: The inclusion of the EMA filter adds an extra layer of reliability to the signals. By confirming divergences with the EMA, traders can avoid false signals and focus on high-probability trading opportunities.
- Visual Signals: The indicator provides clear visual cues, marking divergences directly on the chart. This makes it easy to identify potential buy and sell signals at a glance, without needing to sift through complex data.
- Improved Accuracy: The combination of RSI divergences with EMA filtering helps traders increase their accuracy in timing market entries and exits, ultimately leading to better trading results.
- Versatility: This indicator works across different timeframes and asset classes, making it suitable for day traders, swing traders, and even long-term investors.
How Does the RSI Divergence Buy/Sell Indicator with EMA Filter Work?
Let’s break down how the RSI Divergence Buy/Sell Indicator works and how it can be applied to your TradingView charts for better trading decisions:
1. RSI Divergence Detection
The core function of the indicator is to scan for bullish and bearish divergences between the price and the RSI. Here’s how it works:
- Bullish Divergence: Occurs when the price forms lower lows, but the RSI forms higher lows. This indicates weakening downward momentum and signals a potential price reversal to the upside.
- Bearish Divergence: Happens when the price forms higher highs, but the RSI forms lower highs. This suggests that the upward momentum is slowing, and a price reversal to the downside may be imminent.
These divergences are key signals that a price reversal could be on the horizon, giving traders the opportunity to prepare for potential buy or sell setups.
2. EMA Confirmation
Once a divergence is detected, the indicator doesn’t just rely on the divergence alone. It incorporates an Exponential Moving Average (EMA) to confirm the signal. The EMA is a moving average that reacts faster to price changes than a simple moving average (SMA), making it ideal for filtering out noise in the market.
Here’s how the EMA filter works in conjunction with the RSI divergence:
- If a bullish divergence is detected, the price should ideally be above the EMA line, signaling that the price has gained enough momentum to support a potential upward move.
- In the case of a bearish divergence, the price should be below the EMA, confirming that downward momentum is strong enough to suggest a decline in price.
By using this dual-layer system of divergence detection and EMA confirmation, traders can reduce false signals and increase the chances of catching significant market moves.
3. Visual Cues on the Chart
Once a divergence is confirmed, the indicator provides clear visual markers on the chart. Bullish divergences might be represented with an upward arrow or green indicator, while bearish divergences could be marked with a downward arrow or red signal. These visual cues make it easy for traders to spot potential buy or sell signals at a glance, without needing to analyze the underlying data manually.
4. Actionable Trading Insights
Once the RSI divergence is detected and confirmed by the EMA, traders can use these signals to make informed decisions about entering or exiting trades. Here’s how you can apply the indicator’s insights to your trading strategy:
- Bullish Divergence: If the indicator shows a bullish divergence and the EMA confirms the signal, it might be a good time to enter a buy trade. This can be especially effective when combined with other technical tools such as support/resistance levels or candlestick patterns.
- Bearish Divergence: On the flip side, a bearish divergence confirmed by the EMA might suggest it’s time to consider a sell trade or to tighten stop-loss levels if you’re holding a long position.
This combination of divergence detection and EMA confirmation gives traders a more comprehensive view of market conditions, allowing for better timing of market entries and exits.
Using the RSI Divergence Buy/Sell Indicator on TradingView
If you’re using TradingView, applying the RSI Divergence Buy/Sell Indicator with EMA Filter is straightforward. Follow these steps to set it up and start using it in your trading:
- Add the Indicator: Search for the “RSI Divergence Buy/Sell Indicator with EMA Filter” in the TradingView indicator library and add it to your chart.
- Customize Settings: Depending on your trading style, you may want to customize the RSI period, EMA length, and other parameters to suit your needs.
- Analyze the Chart: Once the indicator is applied, look for visual signals such as arrows or labels indicating divergences. Check whether these signals are confirmed by the EMA for added confidence in your trades.
- Execute Trades: Use the divergence signals as a guide for entering or exiting trades. For instance, enter a long position when a bullish divergence is confirmed, or exit a trade when a bearish divergence appears.
Pinescript using "RSI Divergence Indicator with EMA Filter"

//@version=5
indicator(title="RSI Divergence Indicator with EMA Filter", format=format.price, timeframe="", timeframe_gaps=true,overlay =true)
len = input.int(title="RSI Period", minval=1, defval=14)
src = input(title="RSI Source", defval=close)
lbR = input(title="Pivot Lookback Right", defval=5, display = display.data_window)
lbL = input(title="Pivot Lookback Left", defval=5, display = display.data_window)
rangeUpper = input(title="Max of Lookback Range", defval=60, display = display.data_window)
rangeLower = input(title="Min of Lookback Range", defval=5, display = display.data_window)
plotBull = input(title="Plot Bullish", defval=true, display = display.data_window)
plotHiddenBull = input(title="Plot Hidden Bullish", defval=false, display = display.data_window)
plotBear = input(title="Plot Bearish", defval=true, display = display.data_window)
plotHiddenBear = input(title="Plot Hidden Bearish", defval=false, display = display.data_window)
bearColor = color.red
bullColor = color.green
hiddenBullColor = color.new(color.green, 80)
hiddenBearColor = color.new(color.red, 80)
textColor = color.white
noneColor = color.new(color.white, 100)
osc = ta.rsi(src, len)

// EMA Filter
emaLen = input.int(title="EMA Length", minval=1, defval=50)
ema = ta.ema(src, emaLen)

// Plot EMA
plot(ema, title="EMA", color=color.orange, linewidth=2)

plFound = na(ta.pivotlow(osc, lbL, lbR)) ? false : true
phFound = na(ta.pivothigh(osc, lbL, lbR)) ? false : true
_inRange(cond) =>
    bars = ta.barssince(cond == true)
    rangeLower <= bars and bars <= rangeUpper

//------------------------------------------------------------------------------
// Regular Bullish
// Osc: Higher Low

oscHL = osc[lbR] > ta.valuewhen(plFound, osc[lbR], 1) and _inRange(plFound[1])

// Price: Lower Low

priceLL = low[lbR] < ta.valuewhen(plFound, low[lbR], 1)
bullCondAlert = priceLL and oscHL and plFound
bullCond = plotBull and bullCondAlert

//------------------------------------------------------------------------------
// Hidden Bullish
// Osc: Lower Low

oscLL = osc[lbR] < ta.valuewhen(plFound, osc[lbR], 1) and _inRange(plFound[1])

// Price: Higher Low

priceHL = low[lbR] > ta.valuewhen(plFound, low[lbR], 1)
hiddenBullCondAlert = priceHL and oscLL and plFound
hiddenBullCond = plotHiddenBull and hiddenBullCondAlert

//------------------------------------------------------------------------------
// Regular Bearish
// Osc: Lower High

oscLH = osc[lbR] < ta.valuewhen(phFound, osc[lbR], 1) and _inRange(phFound[1])

// Price: Higher High

priceHH = high[lbR] > ta.valuewhen(phFound, high[lbR], 1)

bearCondAlert = priceHH and oscLH and phFound
bearCond = plotBear and bearCondAlert

//------------------------------------------------------------------------------
// Hidden Bearish
// Osc: Higher High

oscHH = osc[lbR] > ta.valuewhen(phFound, osc[lbR], 1) and _inRange(phFound[1])

// Price: Lower High

priceLH = high[lbR] < ta.valuewhen(phFound, high[lbR], 1)

hiddenBearCondAlert = priceLH and oscHH and phFound
hiddenBearCond = plotHiddenBear and hiddenBearCondAlert

alertcondition(bullCondAlert, title='Regular Bullish Divergence', message="Found a new Regular Bullish Divergence, `Pivot Lookback Right` number of bars to the left of the current bar")
alertcondition(hiddenBullCondAlert, title='Hidden Bullish Divergence', message='Found a new Hidden Bullish Divergence, `Pivot Lookback Right` number of bars to the left of the current bar')
alertcondition(bearCondAlert, title='Regular Bearish Divergence', message='Found a new Regular Bearish Divergence, `Pivot Lookback Right` number of bars to the left of the current bar')
alertcondition(hiddenBearCondAlert, title='Hidden Bearish Divergence', message='Found a new Hidden Bearish Divergence, `Pivot Lookback Right` number of bars to the left of the current bar')

//------------------------------------------------------------------------------
// Buy/Sell Signals with EMA Filter
// Buy Signal: Bullish divergence + price above EMA
buySignal = bullCond and close > ema
plotshape(buySignal, style=shape.labelup, location=location.belowbar, color=#1be100, size=size.tiny, title='Buy', text='Buy', textcolor=color.white)

// Sell Signal: Bearish divergence + price below EMA
sellSignal = bearCond and close < ema
plotshape( sellSignal, style=shape.labeldown, location=location.abovebar, color=#fc0000, size=size.tiny, title='Sell', text='Sell', textcolor=color.white)
Conclusion
The RSI Divergence Buy/Sell Indicator with EMA Filter offers traders a reliable method to identify key market reversals with enhanced precision. By combining the power of RSI divergences with the filtering ability of the Exponential Moving Average, it helps reduce noise and false signals, leading to more confident and profitable trades. Whether you’re looking to improve your timing for market entries or refine your exit strategies, this indicator can become a valuable addition to your trading toolkit. As with any trading tool, it works best when combined with other technical analysis methods, so take the time to practice and find a setup that fits your personal trading style.
Start using the indicator today and unlock new possibilities in your trading journey!
Disclaimer
Trading involves significant risk, and you should be aware that past performance does not guarantee future results. The RSI Divergence Buy/Sell Indicator with EMA Filter is a technical tool meant to aid in decision-making, but it should not be used as the sole basis for trading decisions. Always do your own research and consult with a financial advisor if necessary. The content provided in this article is for informational purposes only and does not constitute financial advice.

0 Comments