🔓 Get All Tools for FREE!
- ✅ Click here to open a trading account using our referral link and start trading.
- 📅 After 7 days of active trading under our referral link, you can get access to all tools in your account.
- ⚠️ Keep trading to keep access free — if you're inactive for 7 days, your access will be removed.
- 👉 Already have an account? You can change the IB (introducing broker) to our referral link ( https://one.exnesstrack.org/a/w7syl3vnjb ) and still qualify!
The Moving Average Convergence Divergence (MACD) is a widely used technical indicator in trading that helps in analyzing price momentum and potential trend reversals. While the standard MACD indicator is highly effective for monitoring market conditions, it is typically applied to a single timeframe, limiting its scope for traders who need a broader market perspective. To overcome this limitation, the Multi-Timeframe MACD Trend indicator offers a solution by allowing traders to analyze market trends across multiple timeframes simultaneously. This powerful indicator enhances decision-making by providing a holistic view of short-term, medium-term, and long-term trends, all in one chart.
In this article, we will explore the features, working principles, and benefits of using the Multi-Timeframe MACD Trend indicator in TradingView.
Understanding the Multi-Timeframe MACD Trend Indicator
What Is MACD?
Before diving into the multi-timeframe version, let’s revisit the basics of MACD. The MACD indicator consists of three primary components:
🔓 Get All Tools for FREE!
- ✅ Click here to open a trading account using our referral link and start trading.
- 📅 After 7 days of active trading under our referral link, you can get access to all tools in your account.
- ⚠️ Keep trading to keep access free — if you're inactive for 7 days, your access will be removed.
- 👉 Already have an account? You can change the IB (introducing broker) to our referral link ( https://one.exnesstrack.org/a/w7syl3vnjb ) and still qualify!
- MACD Line: The difference between the 12-period and 26-period Exponential Moving Averages (EMAs).
- Signal Line: A 9-period EMA of the MACD line.
- Histogram: Represents the difference between the MACD line and the signal line.
When the MACD line crosses above the signal line, it signals a potential bullish trend, whereas when the MACD line crosses below the signal line, it signals a bearish trend.
What Is the Multi-Timeframe MACD Trend Indicator?
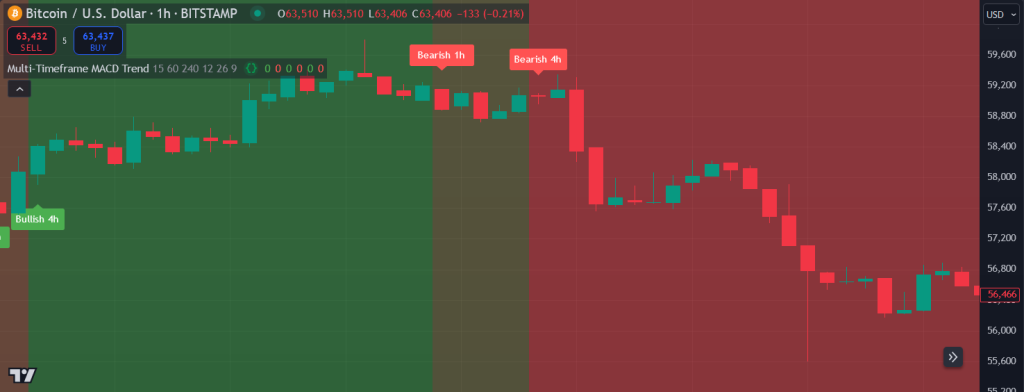
The Multi-Timeframe MACD Trend indicator in TradingView enhances the traditional MACD by calculating and displaying MACD values across three distinct timeframes: 15 minutes, 1 hour, and 4 hours. This gives traders a broader perspective of the market’s movements, helping them make more informed trading decisions.
By analyzing different timeframes, the indicator enables traders to:
- Capture short-term volatility (15-minute MACD)
- Observe medium-term trends (1-hour MACD)
- Gauge long-term direction (4-hour MACD)
This multi-timeframe analysis is especially beneficial for day traders, swing traders, and long-term investors who want to align their entries and exits with broader market trends.
Key Features of the Multi-Timeframe MACD Trend Indicator
- Customizable Timeframes: Traders can input their preferred timeframes for analysis. While the default is set to 15 minutes, 1 hour, and 4 hours, these can be customized based on individual strategies.
- MACD Calculation for Each Timeframe: The indicator calculates the MACD values for each selected timeframe. This allows traders to simultaneously monitor price momentum across different timeframes, aiding in more accurate trade planning.
- Trend Detection: The indicator identifies bullish and bearish trends based on the crossover of the MACD line and the signal line in each timeframe.
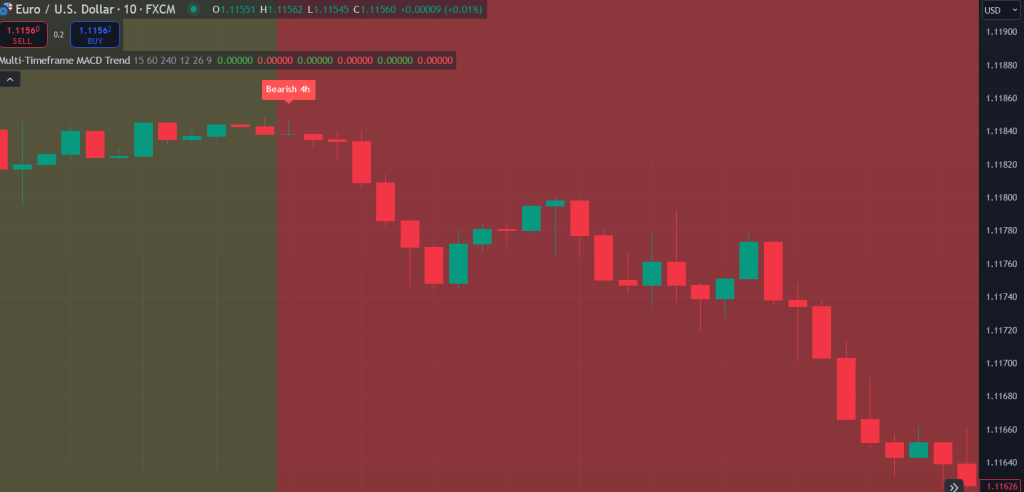
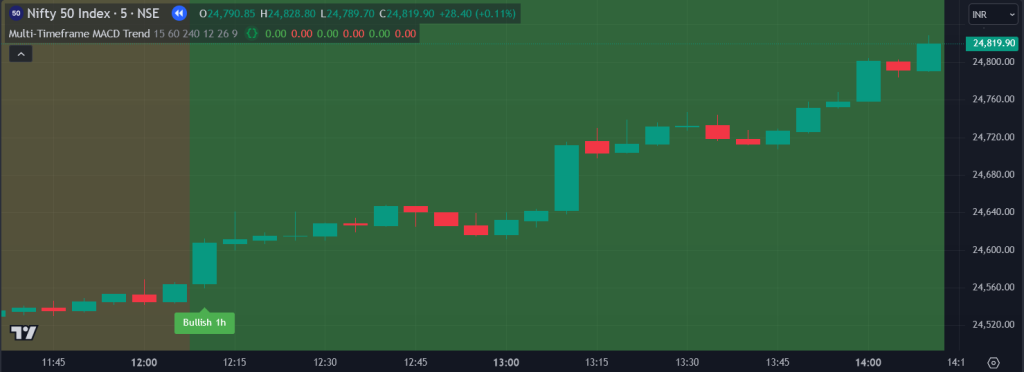
- Visual Cues: To make trend analysis easier, the indicator highlights bullish and bearish trends with colored backgrounds on the chart. Green for bullish trends and red for bearish trends.
- Signal Markers: The indicator places signal markers on the chart to show buy and sell opportunities based on trend crossovers in the multiple timeframes.
- Real-Time Updates: As the price fluctuates, the indicator dynamically updates the MACD values, ensuring traders always have the most current information.
How the Multi-Timeframe MACD Trend Indicator Works
1. Input Timeframes
When setting up the indicator, users are prompted to select three different timeframes. This flexibility allows the trader to analyze the market based on their unique strategy or trading style. For example, a day trader might choose the 5-minute, 15-minute, and 1-hour timeframes, while a swing trader might prefer the 1-hour, 4-hour, and daily timeframes.
2. MACD Calculation
Once the timeframes are set, the script calculates MACD values for each one. These calculations are based on the same principle as the traditional MACD, comparing two EMAs to assess momentum.
3. Trend Detection and Signal Generation
The indicator uses the crossover of the MACD line and signal line to detect bullish or bearish trends within each timeframe. When the MACD line crosses above the signal line, it suggests that the trend is bullish for that particular timeframe. Conversely, if the MACD line crosses below the signal line, it indicates a bearish trend.
The signal markers (buy and sell points) are displayed on the chart at each crossover, making it easy for traders to identify potential entry and exit points.
4. Visual Cues
To further assist with trend identification, the indicator shades the background of the chart based on the overall trend direction. Green backgrounds indicate a bullish trend, while red backgrounds indicate a bearish trend. This visual aid allows traders to quickly assess the prevailing market condition at a glance.
5. Real-Time Dynamic Updates
As market prices fluctuate, the indicator continuously updates the MACD calculations and the trend signals in real-time. This ensures that traders always have access to the most up-to-date information and can adjust their strategies accordingly.
Benefits of Using the Multi-Timeframe MACD Trend Indicator
1. Comprehensive Market View
By incorporating multiple timeframes, the Multi-Timeframe MACD Trend indicator offers a more comprehensive view of the market than single-timeframe analysis. Traders can identify conflicting signals across timeframes and avoid trades that align with short-term trends but go against longer-term market movements.
2. Better Trade Entries and Exits
The indicator helps traders pinpoint precise entry and exit points by analyzing multiple timeframes. If all timeframes show alignment in trend direction (bullish or bearish), it provides a stronger signal, increasing the likelihood of a successful trade.
3. Improved Risk Management
With its multi-timeframe analysis, the indicator can be used to manage risk more effectively. Traders can enter positions when the overall trend across all timeframes aligns, reducing the risk of being caught in a reversal or false signal.
4. Suitable for Different Trading Styles
Whether you are a day trader, swing trader, or long-term investor, the flexibility of the timeframes makes this indicator adaptable to various trading styles. Traders can customize it according to their specific needs, making it a versatile tool in any trading strategy.
Pinescript code of Multi-Timeframe MACD Trend

//@version=5
indicator("Multi-Timeframe MACD Trend", overlay=true)

// Input fields for multiple timeframes
tf1 = input.timeframe("15", title="Lower Timeframe (e.g., 15min)")
tf2 = input.timeframe("60", title="Middle Timeframe (e.g., 1 Hour)")
tf3 = input.timeframe("240", title="Higher Timeframe (e.g., 4 Hours)")

// MACD Function for different timeframes (price series is passed directly as 'close')
get_macd(_fastlen, _slowlen, _signallen, _timeframe) =>
    [macdLine, signalLine, _] = ta.macd(request.security(syminfo.tickerid, _timeframe, close), _fastlen, _slowlen, _signallen)
    [macdLine, signalLine]

// MACD settings
fastLength = input(12, title="MACD Fast Length")
slowLength = input(26, title="MACD Slow Length")
signalSmoothing = input(9, title="MACD Signal Smoothing")

// Getting MACD values from different timeframes
[macd1, signal1] = get_macd(fastLength, slowLength, signalSmoothing, tf1)
[macd2, signal2] = get_macd(fastLength, slowLength, signalSmoothing, tf2)
[macd3, signal3] = get_macd(fastLength, slowLength, signalSmoothing, tf3)

// Trend determination for each timeframe
bullishTrend1 = macd1 > signal1
bearishTrend1 = macd1 < signal1
bullishTrend2 = macd2 > signal2
bearishTrend2 = macd2 < signal2
bullishTrend3 = macd3 > signal3
bearishTrend3 = macd3 < signal3

// Plotting trend indicators for each timeframe
bgcolor(bullishTrend1 ? color.new(color.green, 90) : na, title="15m Bullish Background")
bgcolor(bearishTrend1 ? color.new(color.red, 90) : na, title="15m Bearish Background")
bgcolor(bullishTrend2 ? color.new(color.green, 80) : na, title="1h Bullish Background")
bgcolor(bearishTrend2 ? color.new(color.red, 80) : na, title="1h Bearish Background")
bgcolor(bullishTrend3 ? color.new(color.green, 70) : na, title="4h Bullish Background")
bgcolor(bearishTrend3 ? color.new(color.red, 70) : na, title="4h Bearish Background")

// Plotting signals on the chart
plotshape(series=bullishTrend1 and ta.crossover(macd1, signal1), title="Bullish Signal (15m)", location=location.belowbar, color=color.green, style=shape.labelup, text="Bullish 15m", size=size.small, textcolor=color.white)
plotshape(series=bearishTrend1 and ta.crossunder(macd1, signal1), title="Bearish Signal (15m)", location=location.abovebar, color=color.red, style=shape.labeldown, text="Bearish 15m", size=size.small, textcolor=color.white)
plotshape(series=bullishTrend2 and ta.crossover(macd2, signal2), title="Bullish Signal (1h)", location=location.belowbar, color=color.green, style=shape.labelup, text="Bullish 1h", size=size.small, textcolor=color.white)
plotshape(series=bearishTrend2 and ta.crossunder(macd2, signal2), title="Bearish Signal (1h)", location=location.abovebar, color=color.red, style=shape.labeldown, text="Bearish 1h", size=size.small, textcolor=color.white)
plotshape(series=bullishTrend3 and ta.crossover(macd3, signal3), title="Bullish Signal (4h)", location=location.belowbar, color=color.green, style=shape.labelup, text="Bullish 4h", size=size.small, textcolor=color.white)
plotshape(series=bearishTrend3 and ta.crossunder(macd3, signal3), title="Bearish Signal (4h)", location=location.abovebar, color=color.red, style=shape.labeldown, text="Bearish 4h", size=size.small, textcolor=color.white)
Conclusion
The Multi-Timeframe MACD Trend indicator is a powerful tool for traders seeking to gain a holistic view of the market. By analyzing multiple timeframes simultaneously, it offers deeper insights into market trends and helps traders make more informed decisions. With its real-time dynamic updates, customizable timeframes, and visual trend cues, this indicator can become a critical component of a trader’s toolkit, whether you’re navigating short-term volatility or capitalizing on long-term market movements.
Disclaimer:
Trading involves substantial risk and is not suitable for every investor. The Multi-Timeframe MACD Trend Indicator discussed in this article is for informational and educational purposes only. Past performance is not indicative of future results, and the author assumes no responsibility for any losses or damages incurred as a result of using this indicator. It is strongly recommended to do your own research or consult with a professional financial advisor before making any investment decisions.

0 Comments