🔓 Get All Tools for FREE!
- ✅ Click here to open a trading account using our referral link and start trading.
- 📅 After 7 days of active trading under our referral link, you can get access to all tools in your account.
- ⚠️ Keep trading to keep access free — if you're inactive for 7 days, your access will be removed.
- 👉 Already have an account? You can change the IB (introducing broker) to our referral link ( https://one.exnesstrack.org/a/w7syl3vnjb ) and still qualify!
In the ever-evolving world of trading, the tools and strategies you utilize can significantly influence your success. One such powerful tool is the Multi-Timeframe Volume Profile Indicator available on TradingView. This custom indicator takes the concept of traditional volume profiles and elevates it by displaying volume data across multiple timeframes on a single chart. In this article, we will delve into what the Multi-Timeframe Volume Profile is, how it works, and how you can effectively use it to enhance your trading strategies.
What is the Multi-Timeframe Volume Profile Indicator?
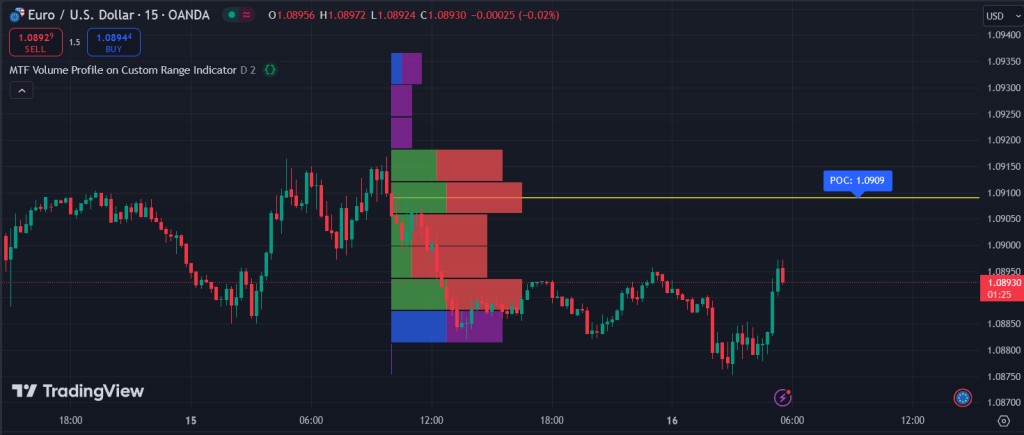
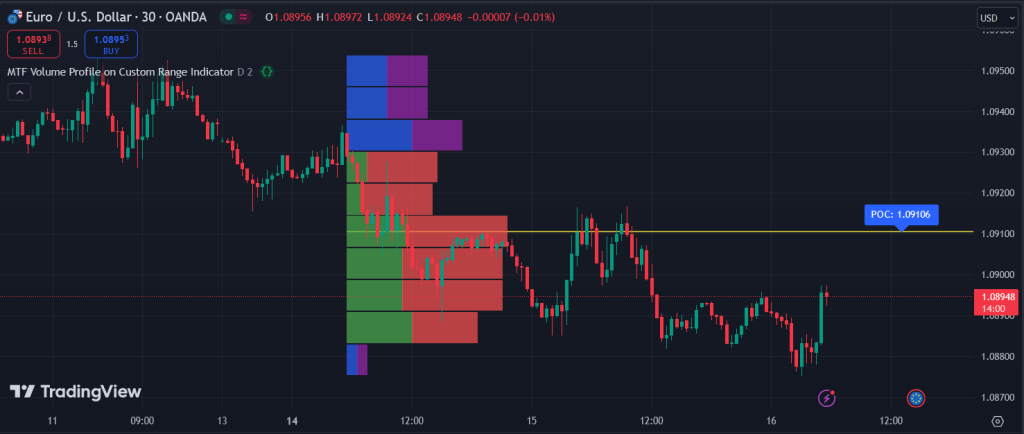
The Multi-Timeframe Volume Profile is an advanced analytical tool designed to provide traders with a deeper understanding of market behavior. Unlike standard volume profile indicators that only show volume data for a single timeframe, this custom indicator aggregates volume data from various timeframes—daily, weekly, and monthly—allowing traders to see the complete picture of trading activity.
Key Features of the Multi-Timeframe Volume Profile Indicator
- Multiple Timeframe Analysis: It displays volume profiles from different timeframes simultaneously, enabling traders to identify trends and significant price levels more effectively.
- Identification of Support and Resistance: By analyzing volume distribution across timeframes, traders can pinpoint key levels where buying and selling pressure has been significant, thereby identifying potential support and resistance zones.
- Enhanced Decision Making: With a clearer understanding of where the most significant volume occurs, traders can make informed decisions about entry and exit points, increasing their chances of success.
- Visual Clarity: The indicator provides a visual representation of volume data, making it easier to analyze and interpret market behavior.
How the Multi-Timeframe Volume Profile Works
The functionality of the Multi-Timeframe Volume Profile revolves around the aggregation of volume data from various timeframes. Here’s how it operates:
🔓 Get All Tools for FREE!
- ✅ Click here to open a trading account using our referral link and start trading.
- 📅 After 7 days of active trading under our referral link, you can get access to all tools in your account.
- ⚠️ Keep trading to keep access free — if you're inactive for 7 days, your access will be removed.
- 👉 Already have an account? You can change the IB (introducing broker) to our referral link ( https://one.exnesstrack.org/a/w7syl3vnjb ) and still qualify!
- Data Aggregation: The indicator collects volume data from different timeframes and combines it into a single view. This aggregation allows traders to observe volume trends over both short and long periods.
- Volume Distribution Analysis: By analyzing how volume is distributed across different price levels, traders can identify where significant trading activity has occurred. This information is crucial for recognizing trends and potential reversals.
- Critical Level Identification: The Multi-Timeframe Volume Profile helps traders identify critical price levels where past trading activity suggests that buyers or sellers may enter the market again. This can guide trading strategies and inform potential entry and exit points.
Benefits of Using the Multi-Timeframe Volume Profile
Utilizing the Multi-Timeframe Volume Profile Indicator offers numerous advantages for traders:
- Deeper Market Insights: With the ability to analyze multiple timeframes at once, traders gain a comprehensive view of market activity, allowing them to make more informed decisions.
- Increased Trading Accuracy: By identifying key support and resistance levels based on actual volume data, traders can refine their strategies and improve the accuracy of their trades.
- Enhanced Risk Management: Understanding where significant trading activity has occurred can help traders manage their risk more effectively, as they can place stop-loss orders around key levels.
- Adaptability to Various Trading Styles: Whether you are a day trader, swing trader, or long-term investor, the Multi-Timeframe Volume Profile can be tailored to fit your trading style, providing valuable insights regardless of your approach.
How to Use the Multi-Timeframe Volume Profile on TradingView
Using the Multi-Timeframe Volume Profile Indicator on TradingView is straightforward. Follow these steps to integrate it into your trading strategy:
1. Add the Indicator
- Open TradingView and navigate to your desired chart.
- Click on the “Indicators” button at the top of the screen.
- Search for “Multi-Timeframe Volume Profile” and select it from the list.
2. Set Timeframes
- Once the indicator is added to your chart, you can configure the timeframes you wish to analyze.
- Common timeframes include 1-hour, daily, and weekly. Select the timeframes that align with your trading strategy.
3. Analyze Volume Profiles
- Observe the volume profiles displayed for each selected timeframe. The indicator will highlight areas of high volume, indicating potential support and resistance levels.
- Look for patterns in the volume distribution. Are there specific price levels that have consistently attracted trading activity?
4. Make Decisions
- Use the information gleaned from the Multi-Timeframe Volume Profile to inform your trading decisions.
- Identify potential entry and exit points based on the volume profiles and their relation to current price action.
- Consider placing trades near significant support and resistance levels highlighted by the indicator.
Contact us at +91 7620658346 for access to this indicator. We offer algo development for TradingView indicators, MT4/MT5, and trading bots. Follow us on Instagram, YouTube, and Twitter @algo_aakash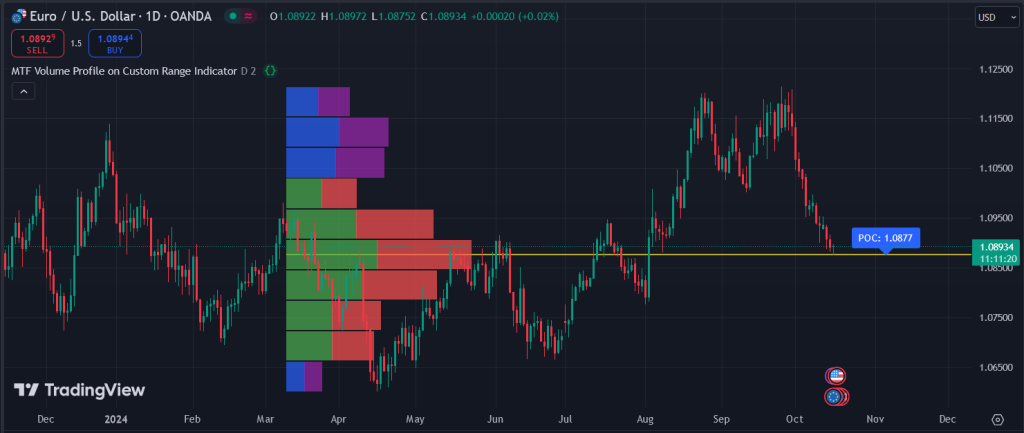
Conclusion
The Multi-Timeframe Volume Profile Indicator on TradingView is a game-changer for traders seeking to enhance their market analysis. By providing a comprehensive view of volume data across multiple timeframes, this tool enables traders to uncover hidden trends, identify key support and resistance levels, and make more informed trading decisions. Whether you are a seasoned trader or just starting, leveraging this powerful indicator can significantly improve your trading performance.
Disclaimer
The information provided in this article is for educational and informational purposes only and should not be construed as financial advice. Trading in financial markets involves significant risk, and it is possible to lose more than your initial investment. The Multi-Timeframe Volume Profile Indicator and other tools mentioned may enhance your trading analysis, but they do not guarantee success.
0 Comments