🔓 Get All Tools for FREE!
- ✅ Click here to open a trading account using our referral link and start trading.
- 📅 After 7 days of active trading under our referral link, you can get access to all tools in your account.
- ⚠️ Keep trading to keep access free — if you're inactive for 7 days, your access will be removed.
- 👉 Already have an account? You can change the IB (introducing broker) to our referral link ( https://one.exnesstrack.org/a/w7syl3vnjb ) and still qualify!
Hello, trading enthusiasts! I’m Aakash Raut, and today, we’re diving into a powerful momentum investing strategy indicator inspired by trader Ankush Bajaj’s unique approach. Momentum investing is about capturing significant price movements, and when applied correctly, it can open doors to high-probability setups in both bullish and bearish markets. This guide will walk you through everything you need to know about using this indicator on the TradingView platform to enhance your trading decisions.
What is the Momentum Investing Strategy Indicator?
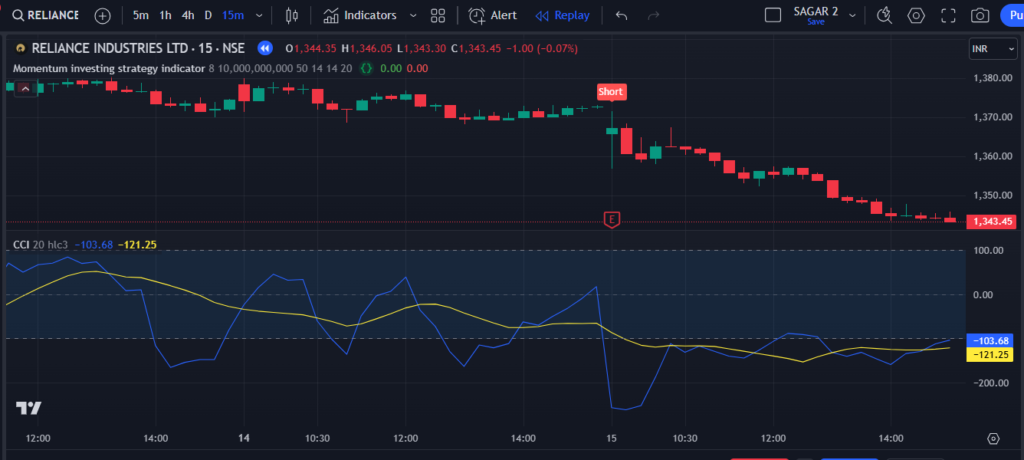
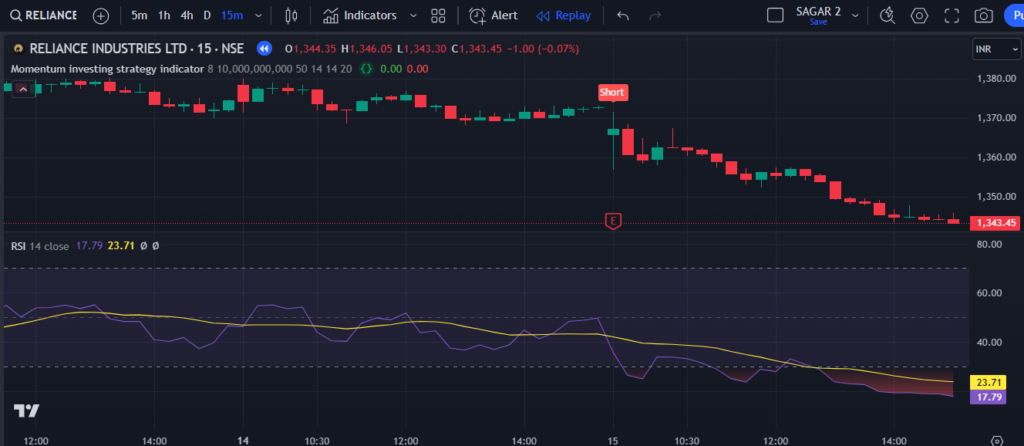
The momentum investing strategy indicator is a custom-designed tool intended for the daily timeframe, drawing inspiration from Ankush Bajaj’s approach to high-probability trades. This indicator combines technical and fundamental factors to deliver quality entry and exit signals. It evaluates criteria like the percentage change over 250 candles, RSI (Relative Strength Index), MFI (Money Flow Index), CCI (Commodity Channel Index), volume, market cap, and price. By combining these key elements, it highlights bullish (long) or bearish (short) setups based on market momentum.
🔓 Get All Tools for FREE!
- ✅ Click here to open a trading account using our referral link and start trading.
- 📅 After 7 days of active trading under our referral link, you can get access to all tools in your account.
- ⚠️ Keep trading to keep access free — if you're inactive for 7 days, your access will be removed.
- 👉 Already have an account? You can change the IB (introducing broker) to our referral link ( https://one.exnesstrack.org/a/w7syl3vnjb ) and still qualify!
Primarily built for long-term investing, this indicator is highly adaptable. By adjusting certain parameters, traders can use it on shorter timeframes to catch quick momentum-based trades. This versatility makes it suitable for both long-term investors and swing traders seeking opportunities in various market conditions.
Understanding the Key Components of the Momentum Indicator
This momentum indicator stands out because it brings together several powerful metrics to help traders identify strong trends. Let’s break down each of these components for a clearer understanding:
- Percentage Change Over 250 Candles
Calculating the percentage price change over the last 250 candles reveals a stock’s long-term price trend. If this figure is high, it suggests a strong uptrend, while a low or negative value indicates a potential downtrend. This helps align trades with the broader market direction, reducing the risk of counter-trend trades. - Relative Strength Index (RSI)
The RSI measures the speed and change of price movements, which helps gauge the current strength of a trend. High RSI values (above 60) indicate bullish momentum, whereas low values (below 40) suggest bearish momentum. Setting these thresholds allows the indicator to capture stocks with strong directional moves. - Money Flow Index (MFI)
MFI, similar to RSI, accounts for both price and volume, giving a nuanced view of buying or selling pressure. An MFI above 60 signals positive buying momentum, while an MFI below 40 shows increased selling pressure. This component validates whether there’s actual interest in the asset, filtering out weaker setups. - Commodity Channel Index (CCI)
The CCI measures the deviation of price from its average, helping identify overbought or oversold conditions. CCI values above 100 suggest strong bullish momentum, while values below -100 indicate bearish momentum. This further confirms whether a trend has the potential to continue in its direction. - Volume Relative to the 20-Period EMA
Volume is crucial in momentum trading, as it confirms the strength behind a price movement. This indicator checks if the current volume is more than five times the 20-period EMA of volume, indicating strong market participation, which is essential for sustaining trends. - Market Capitalization and Price Filters
Market cap filters ensure that only stocks with a market capitalization above ₹1000 Crore are considered, excluding smaller, more volatile stocks. Additionally, the price filter only allows stocks trading above ₹50, helping avoid penny stocks and focusing on quality opportunities.
How Does the Momentum Indicator Work?
In TradingView, this indicator evaluates these essential criteria to identify quality setups for both bullish (long) and bearish (short) trades. Below are the specific entry conditions:
Long Entry Conditions (Bullish Setup):
- % Change over 250 candles: Greater than 8
- RSI: Above 60
- MFI: Above 60
- CCI: Above 100
- Volume: Greater than 5x EMA of Volume (20-period)
- Market Cap: Above ₹1000 Crore
- Price: Above ₹50
When all these conditions align, the indicator signals a long setup, suggesting potential upward momentum in the stock. This setup filters for robust buying interest and healthy market participation, which are critical for capturing sustainable uptrends.
Short Entry Conditions (Bearish Setup):
- % Change over 250 candles: Less than -8
- RSI: Below 40
- MFI: Below 40
- CCI: Below -100
- Volume: Greater than 5x EMA of Volume (20-period)
- Market Cap: Above ₹1000 Crore
- Price: Above ₹50
When these conditions are met, the indicator generates a short setup signal, highlighting potential downward momentum in the asset. By focusing on long-term investments or quick trades, this indicator is your guide to capturing the market’s strongest momentum moves.ng!
Contact us at +91 7620658346 for access to this indicator. We offer algo development for TradingView indicators, MT4/MT5, and trading bots.
Follow us on Instagram, YouTube, a
Conclusion
The momentum investing strategy indicator inspired by Ankush Bajaj’s approach is a powerful tool for identifying profitable setups in both bullish and bearish markets. Combining key indicators like RSI, MFI, CCI, volume, market cap, and price, it pinpoints high-quality entries and exits with accuracy. If you’re looking to boost your edge in momentum-based trading, this indicator provides a comprehensive, data-driven method for navigating market trends. Remember to apply it with consistency, and let it be your guide to more informed, disciplined trades. Happy trading!
Disclaimer
The information provided in this article is for educational and informational purposes only and should not be considered as financial or investment advice. Trading and investing carry a significant risk of loss and may not be suitable for all investors. Always conduct your own research, assess your financial situation, and seek advice from a licensed financial advisor before making any trading or investment decisions. Past performance is not indicative of future results, and no strategy or indicator guarantees profits. The use of this indicator is at your own risk, and I am not liable for any losses or damages arising from its use.

0 Comments