🔓 Get All Tools for FREE!
- ✅ Click here to open a trading account using our referral link and start trading.
- 📅 After 7 days of active trading under our referral link, you can get access to all tools in your account.
- ⚠️ Keep trading to keep access free — if you're inactive for 7 days, your access will be removed.
- 👉 Already have an account? You can change the IB (introducing broker) to our referral link ( https://one.exnesstrack.org/a/w7syl3vnjb ) and still qualify!
In the ever-evolving world of trading, having the right tools can make all the difference. One such powerful tool is the MACD Histogram Divergence Indicator. If you’re looking to enhance your trading strategy, this indicator can provide valuable insights into market movements and trends. In this article, we will explore the features and benefits of the MACD Histogram Divergence Indicator, how it works, and why you should incorporate it into your trading arsenal. Best of all, we’re giving it away for free!
Understanding the MACD Histogram Divergence Indicator
The Moving Average Convergence Divergence (MACD) is a widely-used technical analysis tool that helps traders identify potential buy and sell signals through the relationship between two moving averages. The MACD histogram is a graphical representation of the difference between the MACD line and its signal line. By analyzing the histogram, traders can spot trends, momentum shifts, and divergences between price action and the MACD values.
What is Divergence?
Divergence occurs when the price of an asset moves in the opposite direction of an indicator. In the context of the MACD histogram, this means that while the price may be making new highs or lows, the MACD histogram is not confirming those moves. Such divergences can signal potential trend reversals or continuations, making them crucial for traders seeking to enter or exit positions.
🔓 Get All Tools for FREE!
- ✅ Click here to open a trading account using our referral link and start trading.
- 📅 After 7 days of active trading under our referral link, you can get access to all tools in your account.
- ⚠️ Keep trading to keep access free — if you're inactive for 7 days, your access will be removed.
- 👉 Already have an account? You can change the IB (introducing broker) to our referral link ( https://one.exnesstrack.org/a/w7syl3vnjb ) and still qualify!
How the MACD Histogram Divergence Indicator Works
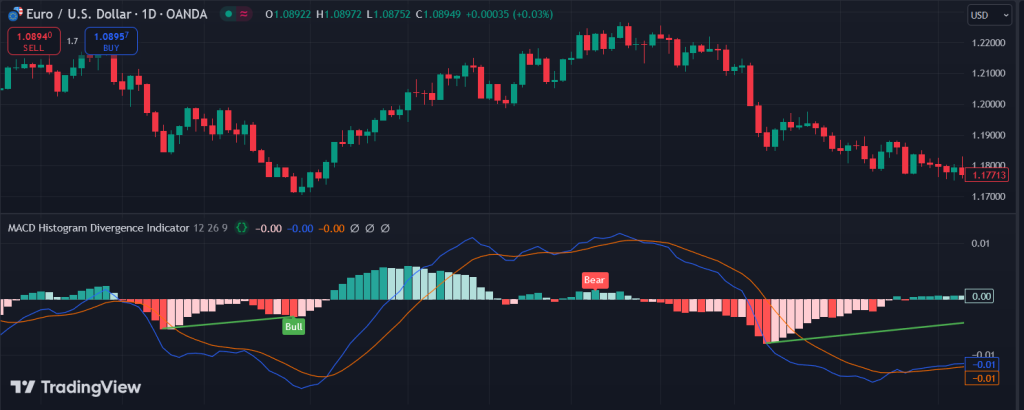
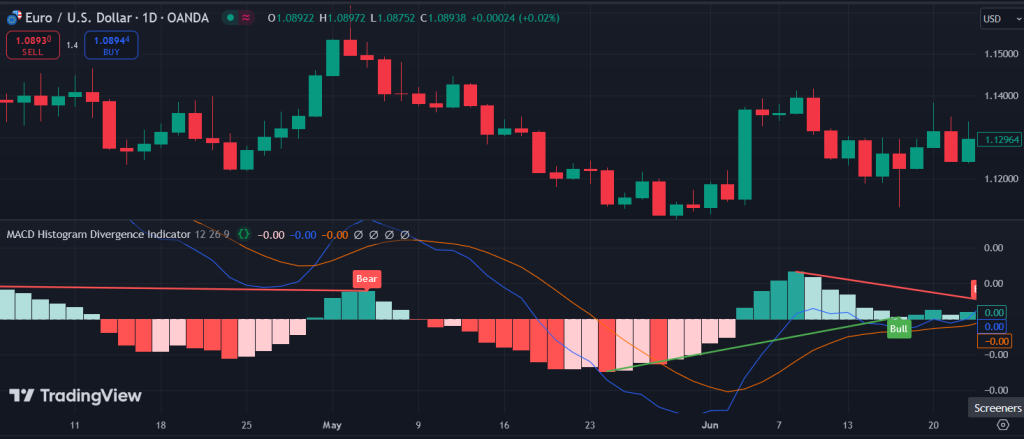
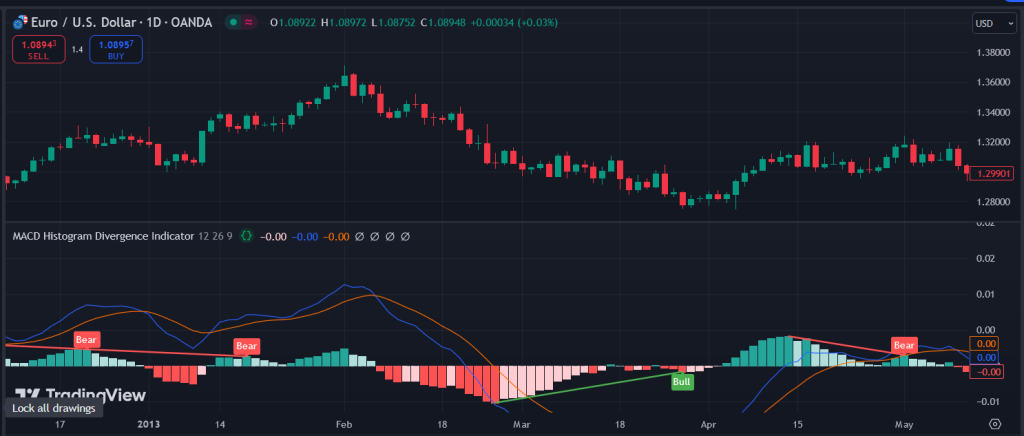
The MACD Histogram Divergence Indicator is designed to highlight these divergences on your chart, making it easier to spot potential trading opportunities. Here’s how it works:
- Identifying Divergences: The indicator automatically analyzes the price movements and MACD histogram values to identify divergences. When the price forms a new high or low, but the MACD histogram fails to mirror that movement, a divergence signal is triggered.
- Visual Cues: The indicator provides visual markers or lines on the chart, indicating where divergences occur. This allows traders to quickly assess potential trend reversals without having to analyze the MACD histogram manually.
- Integration with Other Indicators: The MACD Histogram Divergence Indicator can be combined with other trading indicators, such as trendlines or moving averages, to enhance your overall trading strategy. This holistic approach can improve decision-making and risk management.
Pinescript code of "MACD Histogram Divergence Indicator"

//@version=5
// insta id algo_aakash
indicator(title="MACD Histogram Divergence Indicator", format=format.price, timeframe="", timeframe_gaps=true)

// Input parameters
fastLen = input.int(title="MACD Fast Length", minval=1, defval=12)
slowLen = input.int(title="MACD Slow Length", minval=1, defval=26)
signalLen = input.int(title="MACD Signal Length", minval=1, defval=9)
lbR = input(title="Pivot Lookback Right", defval=5, display = display.data_window)
lbL = input(title="Pivot Lookback Left", defval=5, display = display.data_window)
rangeUpper = input(title="Max of Lookback Range", defval=60, display = display.data_window)
rangeLower = input(title="Min of Lookback Range", defval=5, display = display.data_window)
plotBull = input(title="Plot Bullish", defval=true, display = display.data_window)
plotHiddenBull = input(title="Plot Hidden Bullish", defval=false, display = display.data_window)
plotBear = input(title="Plot Bearish", defval=true, display = display.data_window)
plotHiddenBear = input(title="Plot Hidden Bearish", defval=false, display = display.data_window)

bearColor = color.red
bullColor = color.green
hiddenBullColor = color.new(color.green, 80)
hiddenBearColor = color.new(color.red, 80)
textColor = color.white
noneColor = color.new(color.white, 100)

// Calculate MACD Histogram
[macdLine, signalLine, _] = ta.macd(close, fastLen, slowLen, signalLen)
hist = macdLine - signalLine


hline(0, "Zero Line", color = color.new(#787B86, 50))
plot(hist, title = "Histogram", style = plot.style_columns, color = (hist >= 0 ? (hist[1] < hist ? #26A69A : #B2DFDB) : (hist[1] < hist ? #FFCDD2 : #FF5252)))
plot(macdLine,   title = "MACD",   color = #2962FF)
plot(signalLine, title = "Signal", color = #FF6D00)

plFound = na(ta.pivotlow(hist, lbL, lbR)) ? false : true
phFound = na(ta.pivothigh(hist, lbL, lbR)) ? false : true

_inRange(cond) =>
    bars = ta.barssince(cond == true)
    rangeLower <= bars and bars <= rangeUpper

//------------------------------------------------------------------------------
// Regular Bullish
// Hist: Higher Low
histHL = hist[lbR] > ta.valuewhen(plFound, hist[lbR], 1) and _inRange(plFound[1])

// Price: Lower Low
priceLL = low[lbR] < ta.valuewhen(plFound, low[lbR], 1)
bullCondAlert = priceLL and histHL and plFound
bullCond = plotBull and bullCondAlert

plot(plFound ? hist[lbR] : na,offset=-lbR,title="Regular Bullish",linewidth=2,color=(bullCond ? bullColor : noneColor),display = display.pane)

plotshape(bullCond ? hist[lbR] : na,offset=-lbR,title="Regular Bullish Label",text=" Bull ",style=shape.labelup,location=location.absolute,color=bullColor,textcolor=textColor)

//------------------------------------------------------------------------------
// Hidden Bullish
// Hist: Lower Low
histLL = hist[lbR] < ta.valuewhen(plFound, hist[lbR], 1) and _inRange(plFound[1])

// Price: Higher Low
priceHL = low[lbR] > ta.valuewhen(plFound, low[lbR], 1)
hiddenBullCondAlert = priceHL and histLL and plFound
hiddenBullCond = plotHiddenBull and hiddenBullCondAlert

plot(plFound ? hist[lbR] : na,offset=-lbR,title="Hidden Bullish",linewidth=2,color=(hiddenBullCond ? hiddenBullColor : noneColor),display = display.pane)

plotshape(hiddenBullCond ? hist[lbR] : na,offset=-lbR,title="Hidden Bullish Label",text=" H Bull ",style=shape.labelup,location=location.absolute,color=bullColor,textcolor=textColor)

//------------------------------------------------------------------------------
// Regular Bearish
// Hist: Lower High
histLH = hist[lbR] < ta.valuewhen(phFound, hist[lbR], 1) and _inRange(phFound[1])

// Price: Higher High
priceHH = high[lbR] > ta.valuewhen(phFound, high[lbR], 1)
bearCondAlert = priceHH and histLH and phFound
bearCond = plotBear and bearCondAlert

plot(phFound ? hist[lbR] : na,offset=-lbR,title="Regular Bearish",linewidth=2,color=(bearCond ? bearColor : noneColor),display = display.pane)

plotshape(bearCond ? hist[lbR] : na,offset=-lbR,title="Regular Bearish Label",text=" Bear ",style=shape.labeldown,location=location.absolute,color=bearColor,textcolor=textColor)

//------------------------------------------------------------------------------
// Hidden Bearish
// Hist: Higher High
histHH = hist[lbR] > ta.valuewhen(phFound, hist[lbR], 1) and _inRange(phFound[1])

// Price: Lower High
priceLH = high[lbR] < ta.valuewhen(phFound, high[lbR], 1)
hiddenBearCondAlert = priceLH and histHH and phFound
hiddenBearCond = plotHiddenBear and hiddenBearCondAlert

plot(phFound ? hist[lbR] : na,offset=-lbR,title="Hidden Bearish",linewidth=2,color=(hiddenBearCond ? hiddenBearColor : noneColor),display = display.pane)

plotshape( hiddenBearCond ? hist[lbR] : na, offset=-lbR, title="Hidden Bearish Label", text=" H Bear ", style=shape.labeldown, location=location.absolute, color=bearColor, textcolor=textColor)

// Alerts for conditions
alertcondition(bullCondAlert, title='Regular Bullish Divergence', message="Found a new Regular Bullish Divergence")
alertcondition(hiddenBullCondAlert, title='Hidden Bullish Divergence', message='Found a new Hidden Bullish Divergence')
alertcondition(bearCondAlert, title='Regular Bearish Divergence', message='Found a new Regular Bearish Divergence')
alertcondition(hiddenBearCondAlert, title='Hidden Bearish Divergence', message='Found a new Hidden Bearish Divergence')
Why Use the MACD Histogram Divergence Indicator?
The MACD Histogram Divergence Indicator offers several advantages for traders:
- Clarity: It simplifies the process of identifying divergences, saving time and effort in technical analysis.
- Precision: By focusing on the MACD histogram, this indicator provides more accurate signals compared to traditional divergence indicators that use the Relative Strength Index (RSI).
- Versatility: It can be applied to various financial markets, including forex, stocks, and cryptocurrencies, making it a valuable tool for traders across different asset classes.
Getting Started with the MACD Histogram Divergence Indicator on TradingView
Now that you understand the value of the MACD Histogram Divergence Indicator, let’s discuss how to get started using it on TradingView:
- Add the Indicator: Start by logging into your TradingView account. Search for the MACD Histogram Divergence Indicator in the public library or use the link provided in our video description.
- Customize Settings: Once added to your chart, you can customize the indicator settings to suit your trading style. Adjust parameters like the MACD length, signal length, and histogram color to create a personalized trading experience.
- Analyze the Chart: As you monitor price movements, look for visual cues indicating divergences. When a divergence appears, it may signal a potential buying or selling opportunity.
- Combine with Other Tools: Enhance your analysis by combining the MACD Histogram Divergence Indicator with other indicators or price action strategies. This multi-faceted approach can improve the accuracy of your trading decisions.
- Practice and Monitor: Take time to practice using the indicator in a demo account before applying it to real trades. Monitor your results and adjust your strategy as needed.
Conclusion
In conclusion, the MACD Histogram Divergence Indicator is a valuable addition to any trader’s toolkit, offering clear insights into potential market movements through the identification of divergences. By understanding how to effectively utilize this indicator on TradingView, traders can enhance their analysis and decision-making processes, ultimately improving their trading performance. As you embrace this powerful tool, remember to combine it with sound trading principles and continuous learning. Equip yourself with the knowledge and tools necessary to navigate the complexities of the trading landscape successfully. Happy trading, and may your journey be filled with profitable opportunities!
Disclaimer
The content provided in this article is for informational and educational purposes only and does not constitute financial advice. Trading in financial markets involves risk, and it is possible to lose more than your initial investment. Always conduct thorough research and consider your financial situation before making any trading decisions. It is recommended to consult with a qualified financial advisor to understand the risks involved and to develop a trading strategy that suits your individual needs.

0 Comments