🔓 Get All Tools for FREE!
- ✅ Click here to open a trading account using our referral link and start trading.
- 📅 After 7 days of active trading under our referral link, you can get access to all tools in your account.
- ⚠️ Keep trading to keep access free — if you're inactive for 7 days, your access will be removed.
- 👉 Already have an account? You can change the IB (introducing broker) to our referral link ( https://one.exnesstrack.org/a/w7syl3vnjb ) and still qualify!
In the fast-paced world of trading, effective tools are essential for making informed decisions. One such powerful tool is the EMA Cloud Retest Indicator. This innovative indicator helps traders identify potential buy and sell opportunities based on the behavior of Exponential Moving Averages (EMAs). In this article, we’ll delve into the features, functionalities, and benefits of using the EMA Cloud Retest Indicator to enhance your trading strategy.
Understanding Exponential Moving Averages (EMAs)
Before diving into the specifics of the EMA Cloud Retest Indicator, it’s crucial to understand what Exponential Moving Averages are. EMAs are a type of moving average that places a greater weight on the most recent prices. This characteristic makes EMAs more responsive to price changes compared to Simple Moving Averages (SMAs), which consider all data points equally. Traders often use EMAs to gauge trend direction, determine entry and exit points, and identify potential support and resistance levels.
🔓 Get All Tools for FREE!
- ✅ Click here to open a trading account using our referral link and start trading.
- 📅 After 7 days of active trading under our referral link, you can get access to all tools in your account.
- ⚠️ Keep trading to keep access free — if you're inactive for 7 days, your access will be removed.
- 👉 Already have an account? You can change the IB (introducing broker) to our referral link ( https://one.exnesstrack.org/a/w7syl3vnjb ) and still qualify!
What is the EMA Cloud Retest Indicator?
The EMA Cloud Retest Indicator is designed to help traders make informed trading decisions by utilizing the relationships between multiple EMAs. Specifically, it calculates three EMAs: the 15-period, 20-period, and 50-period EMAs. The indicator creates a visual representation, or “cloud,” between the 20 EMA and the 50 EMA, providing a clear indication of the market’s trend direction.
How It Works:
- Calculation of EMAs: The indicator computes the 15, 20, and 50 EMAs based on the closing prices over their respective periods. These EMAs are then plotted on the chart, with the 20 EMA serving as the central line between the 15 EMA and the 50 EMA.
- EMA Cloud Formation: The area between the 20 EMA and the 50 EMA forms the EMA cloud. This cloud visually represents potential support and resistance zones and helps traders quickly identify the market’s current trend.
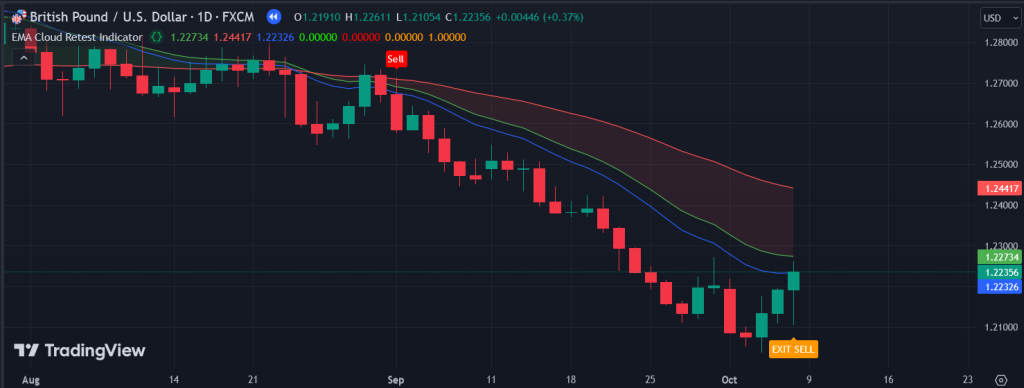
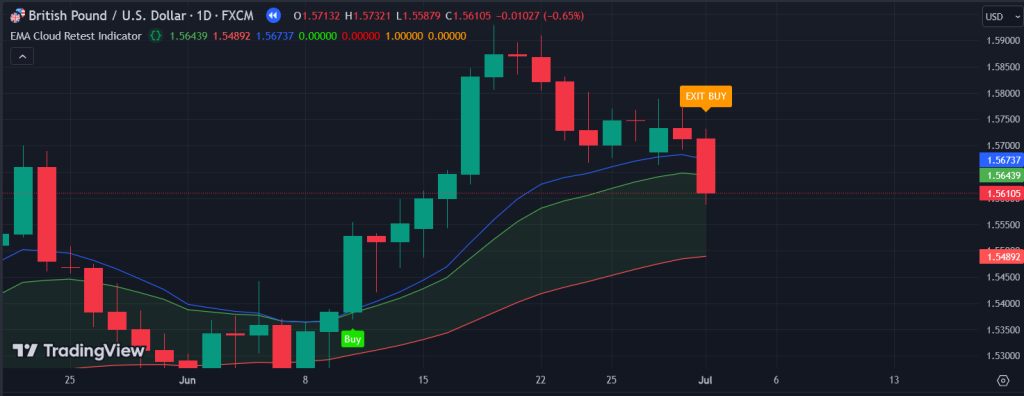
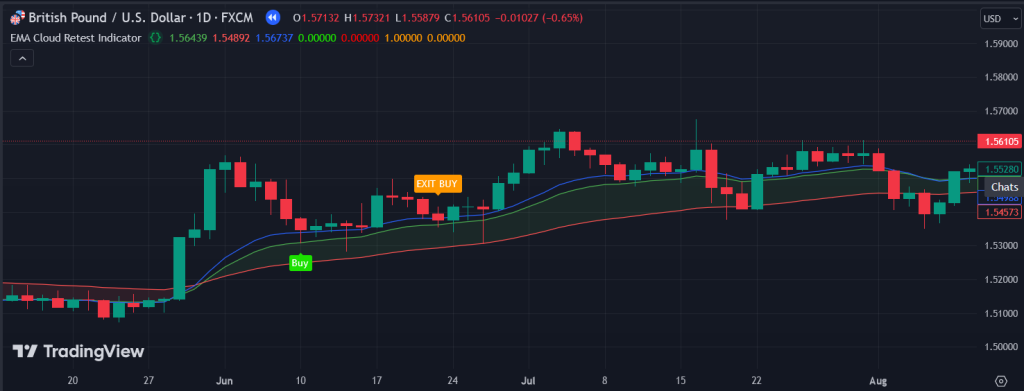
- Signal Generation: The indicator generates buy signals when the price retests the EMA cloud from below while being above the 20 EMA. Conversely, sell signals are triggered when the price retests the cloud from above while being below the 20 EMA. These signals suggest potential market reversals, allowing traders to capitalize on price movements.
Key Features of the EMA Cloud Retest Indicator
- Trend Identification: The EMA cloud provides traders with a clear visual representation of the market trend. When the price is above the cloud, it indicates a bullish trend, while a price below the cloud signifies a bearish trend.
- Buy and Sell Signals: By identifying price retests of the EMA cloud, the indicator helps traders pinpoint optimal entry points. The buy and sell signals generated by the indicator enable traders to act decisively, potentially improving their trading performance.
- Exit Signals: The EMA Cloud Retest Indicator also provides exit signals based on the crossing of the price and the 15 EMA. This feature allows traders to set exit points, helping to maximize profits and minimize losses.
- Custom Alerts: The indicator can be configured to send alerts when significant trading signals occur, such as a price retest of the EMA cloud or an exit signal. These alerts help traders stay informed and make timely decisions, even when they are not actively monitoring the charts.
How to Use the EMA Cloud Retest Indicator in TradingView
Using the EMA Cloud Retest Indicator in TradingView is straightforward and can significantly enhance your trading strategy. Here’s a step-by-step guide on how to effectively use this indicator:
- Add the Indicator to Your Chart: Start by adding the EMA Cloud Retest Indicator to your TradingView chart. You can find it in the indicators section by searching for its name.
- Observe the EMAs: Once the indicator is applied, take note of the plotted EMAs. The 15 EMA will be the fastest, followed by the 20 EMA, and then the 50 EMA. Pay attention to their positions relative to each other, as this can provide insight into the market’s trend.
- Look for Buy Signals: Monitor the price action as it approaches the EMA cloud. If the price retests the cloud from below while remaining above the 20 EMA, this signals a potential buying opportunity. Enter a trade when the buy signal is confirmed.
- Identify Sell Signals: Conversely, if the price retests the cloud from above while remaining below the 20 EMA, this indicates a potential selling opportunity. Enter a trade when the sell signal is confirmed.
- Set Exit Points: Use the exit signals generated by the indicator, which are triggered by the price crossing the 15 EMA. This helps you determine when to close your positions and secure profits.
- Utilize Alerts: Set up alerts for buy, sell, and exit signals to ensure you don’t miss any significant trading opportunities. This feature keeps you informed, even when you’re away from your trading platform.
Advantages of the EMA Cloud Retest Indicator
- Increased Clarity: The visual representation of the EMA cloud simplifies complex market data, making it easier for traders to understand the current market conditions.
- Effective Signal Generation: By focusing on price retests, the indicator helps traders identify potential reversals, enhancing the likelihood of successful trades.
- Flexible Application: The EMA Cloud Retest Indicator can be used across various trading styles, including day trading, swing trading, and long-term investing, making it a versatile tool for all traders.
- Enhanced Decision-Making: With clear signals and alerts, traders can make informed decisions quickly, potentially leading to improved trading outcomes.
Conclusion
The EMA Cloud Retest Indicator is an invaluable tool for traders looking to enhance their trading strategies and improve their decision-making processes. By utilizing the relationships between multiple EMAs, this indicator provides a clear visual representation of market trends, generates actionable buy and sell signals, and offers exit points to maximize profits. Whether you’re a novice trader or an experienced professional, integrating the EMA Cloud Retest Indicator into your TradingView setup can significantly enhance your trading effectiveness. Embrace this powerful indicator and take your trading to the next level!
Disclaimer
The content provided in this article is for informational and educational purposes only and should not be considered as financial or investment advice. Trading in financial markets involves a significant risk of loss and is not suitable for all investors. Past performance is not indicative of future results, and there is no guarantee that any trading strategy will be successful.

0 Comments