🔓 Get All Tools for FREE!
- ✅ Click here to open a trading account using our referral link and start trading.
- 📅 After 7 days of active trading under our referral link, you can get access to all tools in your account.
- ⚠️ Keep trading to keep access free — if you're inactive for 7 days, your access will be removed.
- 👉 Already have an account? You can change the IB (introducing broker) to our referral link ( https://one.exnesstrack.org/a/w7syl3vnjb ) and still qualify!
In the ever-evolving world of trading, having the right tools can make a significant difference in your decision-making process. One such tool is the EMA Cloud Indicator, a powerful technical analysis tool that combines multiple Exponential Moving Averages (EMAs) to help traders identify trends, potential reversals, and entry and exit points. This article will delve into the workings of the EMA Cloud Indicator, its significance in trading, and how to effectively use it in your trading strategy.
What is the EMA Cloud Indicator?
The EMA Cloud Indicator is a sophisticated technical analysis tool that employs two or more Exponential Moving Averages (EMAs) to create a visually appealing and informative cloud on the price chart. Unlike simple moving averages, EMAs give more weight to recent prices, making them more responsive to new information. This indicator primarily consists of a shorter EMA and a longer EMA, which can be customized to suit your trading style.
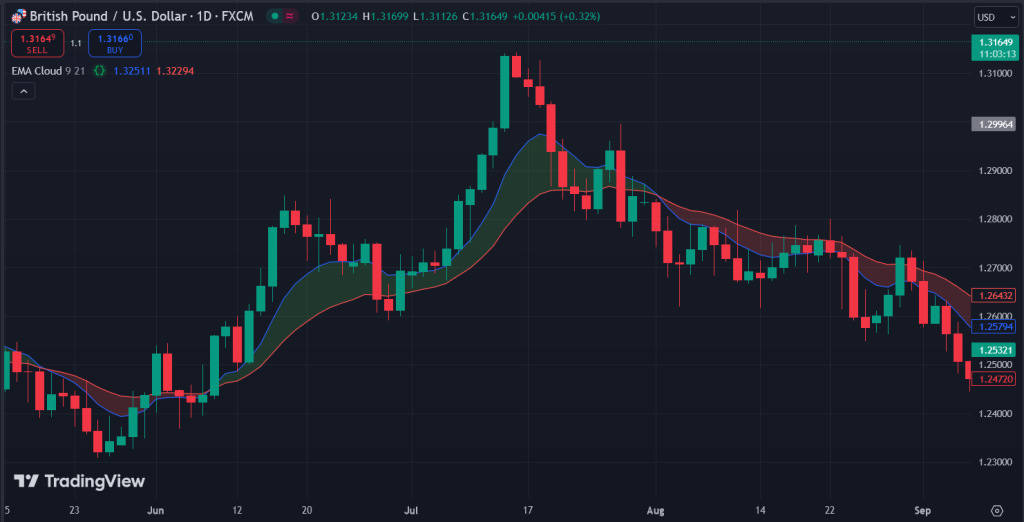
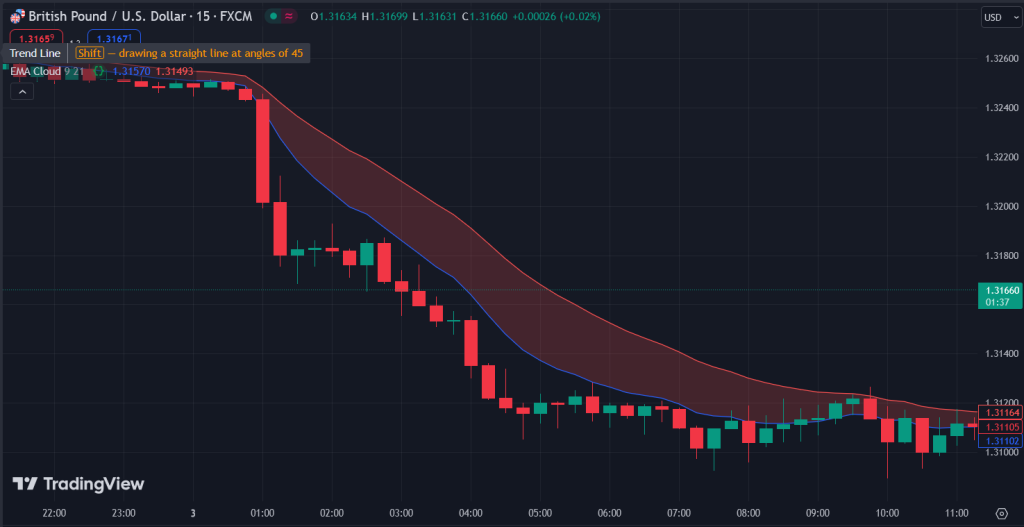
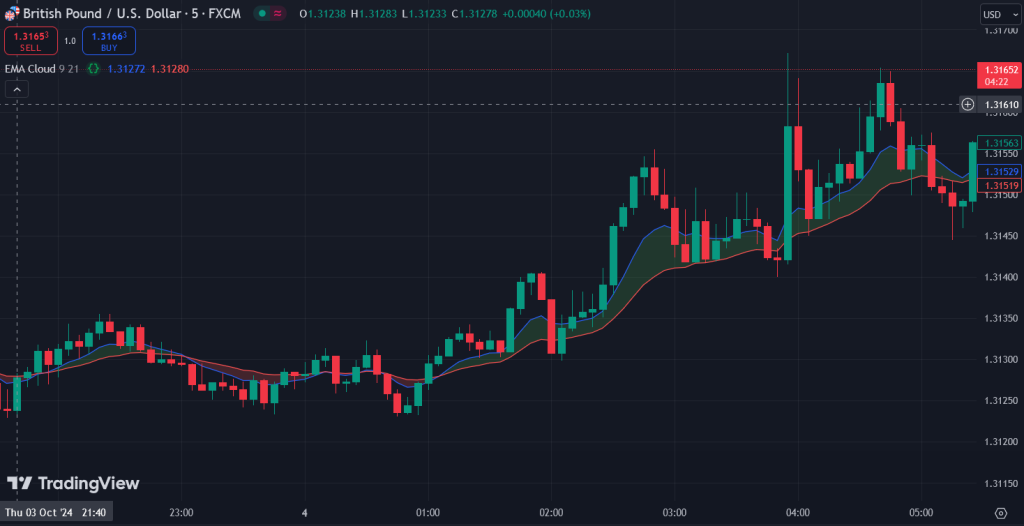
The area between these two EMAs is filled with color, typically green or red, depending on their relationship. When the shorter EMA is above the longer EMA, the cloud is colored green, indicating a bullish trend. Conversely, when the shorter EMA is below the longer EMA, the cloud turns red, signaling a bearish trend. This visual representation helps traders quickly assess the market direction and make informed trading decisions.
🔓 Get All Tools for FREE!
- ✅ Click here to open a trading account using our referral link and start trading.
- 📅 After 7 days of active trading under our referral link, you can get access to all tools in your account.
- ⚠️ Keep trading to keep access free — if you're inactive for 7 days, your access will be removed.
- 👉 Already have an account? You can change the IB (introducing broker) to our referral link ( https://one.exnesstrack.org/a/w7syl3vnjb ) and still qualify!
How Does the EMA Cloud Indicator Work?
Key Components of the EMA Cloud Indicator
- Exponential Moving Averages (EMAs): The EMA Cloud Indicator primarily relies on two EMAs: a short-term EMA and a long-term EMA. The short EMA reacts faster to price changes, while the long EMA provides a more stable view of the trend.
- Dynamic Cloud: The cloud formed between the two EMAs adapts to market conditions. A wider cloud indicates increased volatility, while a narrower cloud suggests a more stable market.
- Crossover Signals: One of the most important features of the EMA Cloud is the crossover signals it generates. A bullish crossover occurs when the short EMA crosses above the long EMA, while a bearish crossover happens when the short EMA crosses below the long EMA. These crossovers can serve as powerful entry and exit signals.
How to Use the EMA Cloud Indicator in TradingView
To effectively use the EMA Cloud Indicator on TradingView, follow these steps:
- Add the Indicator: Start by adding the EMA Cloud Indicator to your TradingView chart. You can do this by searching for the indicator in the TradingView indicator library or by using custom Pine Script code.
- Customize the Settings: Adjust the lengths of the EMAs to fit your trading strategy. Common settings include a 9-period short EMA and a 21-period long EMA, but feel free to experiment based on your trading style and the asset you’re analyzing.
- Analyze the Cloud:
- Trend Identification: Use the color of the cloud to determine the prevailing market trend. A green cloud indicates a bullish trend, while a red cloud signifies a bearish trend.
- Support and Resistance Levels: The area between the EMAs can act as dynamic support and resistance levels. Watch for price action near these levels to identify potential reversal points.
- Monitor Crossover Signals:
- Bullish Crossover: When the short EMA crosses above the long EMA, it generates a bullish signal. This could indicate a good entry point for a long position.
- Bearish Crossover: Conversely, when the short EMA crosses below the long EMA, it signals a potential sell opportunity.
- Incorporate Alerts: Set up alerts for crossover signals and significant price movements. This allows you to stay informed about potential trading opportunities without constantly monitoring the charts.
Advantages of the EMA Cloud Indicator
- Visual Clarity: The cloud visually represents the trend direction and strength, making it easier for traders to make quick decisions based on market conditions.
- Dynamic Support and Resistance: The cloud acts as a dynamic support and resistance level, helping traders identify potential reversal points effectively.
- Responsive to Price Changes: EMAs react quickly to price changes, allowing traders to capture trends early and adjust their strategies accordingly.
- Versatile: The EMA Cloud Indicator can be applied across various asset classes, including stocks, forex, and cryptocurrencies, making it a valuable tool for any trader.
- Combination with Other Indicators: The EMA Cloud works well in conjunction with other technical analysis tools, such as the Relative Strength Index (RSI) or the Moving Average Convergence Divergence (MACD), to enhance trading strategies.
Limitations of the EMA Cloud Indicator
While the EMA Cloud Indicator offers several advantages, it’s essential to be aware of its limitations:
- Lagging Indicator: As a moving average-based indicator, it may lag behind price action, potentially causing traders to miss early signals.
- False Signals: In volatile markets, the indicator may produce false crossover signals. Therefore, it’s crucial to use it in conjunction with other confirmation tools.
- Customization Required: The effectiveness of the EMA Cloud may vary based on the asset and market conditions, requiring traders to adjust the settings for optimal performance.
Pinescript code for "EMA Cloud Indicator"

//@version=5
// insta id algo_aakash
indicator("EMA Cloud", overlay=true)

// Input for EMA lengths
emaLength1 = input.int(9, title="Short EMA Length")
emaLength2 = input.int(21, title="Long EMA Length")

// Calculate EMAs
ema1 = ta.ema(close, emaLength1)
ema2 = ta.ema(close, emaLength2)

// Plot EMAs
h1 = plot(ema1, color=color.blue, title="Short EMA")
h2 = plot(ema2, color=color.red, title="Long EMA")

// Fill the area between the two EMAs
fillColor = ema1 > ema2 ? color.new(color.green, 80) : color.new(color.red, 80)
fill(h1, h2, color=fillColor, title="EMA Cloud")

// Alerts for potential trend changes
alertcondition(ta.crossover(ema1, ema2), title="Bullish Crossover", message="Bullish crossover detected!")
alertcondition(ta.crossunder(ema1, ema2), title="Bearish Crossover", message="Bearish crossover detected!")
Conclusion
The EMA Cloud Indicator is a powerful tool that can enhance your trading strategy by providing visual clarity and dynamic trend analysis. By understanding how to effectively use this indicator in your TradingView charts, you can improve your decision-making process and increase your chances of success in the market.
As with any trading tool, it’s essential to combine the EMA Cloud Indicator with sound risk management and other technical analysis tools to develop a well-rounded trading strategy. Take the time to practice and experiment with this indicator, and watch how it transforms your trading experience.
Disclaimer
Trading involves significant risk, and it is essential to understand that past performance does not guarantee future results. The EMA Cloud Indicator is a technical analysis tool meant to assist in making trading decisions, but it should not be used as the sole basis for entering trades. Always conduct your own research and consider consulting with a financial advisor before making any financial decisions. This content is for informational purposes only and does not constitute financial advice.

0 Comments