🔓 Get All Tools for FREE!
- ✅ Click here to open a trading account using our referral link and start trading.
- 📅 After 7 days of active trading under our referral link, you can get access to all tools in your account.
- ⚠️ Keep trading to keep access free — if you're inactive for 7 days, your access will be removed.
- 👉 Already have an account? You can change the IB (introducing broker) to our referral link ( https://one.exnesstrack.org/a/w7syl3vnjb ) and still qualify!
Fibonacci retracement levels have long been a cornerstone of technical analysis, widely used by traders to identify potential support and resistance levels in the market. However, manually plotting these levels can be time-consuming, and the accuracy of this process largely depends on the precision of the trader. This is where the Custom Fibonacci Retracement Indicator comes into play, simplifying the entire process and allowing traders to focus on what truly matters: making informed trading decisions.
Whether you’re a day trader, swing trader, or long-term investor, this automated tool can save you valuable time and reduce the risk of manual errors, enhancing your overall trading performance. In this guide, we’ll explore the importance of Fibonacci retracement, how the custom indicator works on platforms like TradingView, and why it can be an essential addition to your trading toolkit.
What is Fibonacci Retracement?
Before diving into the details of the custom indicator, it’s essential to understand the basics of Fibonacci retracement. Fibonacci retracement levels are derived from the Fibonacci sequence, a series of numbers where each number is the sum of the two preceding ones. In trading, these numbers are used to identify potential areas of support and resistance based on how much of a prior move the price has retraced.
🔓 Get All Tools for FREE!
- ✅ Click here to open a trading account using our referral link and start trading.
- 📅 After 7 days of active trading under our referral link, you can get access to all tools in your account.
- ⚠️ Keep trading to keep access free — if you're inactive for 7 days, your access will be removed.
- 👉 Already have an account? You can change the IB (introducing broker) to our referral link ( https://one.exnesstrack.org/a/w7syl3vnjb ) and still qualify!
Key Fibonacci levels that traders commonly use are:
- 23.6%: A relatively shallow retracement, indicating a strong trend.
- 38.2%: Often seen as an early sign of a reversal.
- 50%: Not technically a Fibonacci number, but widely used to signify a potential halfway point.
- 61.8%: Known as the “Golden Ratio,” this is one of the most important levels, often indicating a strong reversal point.
- 78.6%: A deeper retracement, suggesting a strong pullback.
These levels are used to predict potential reversal points, allowing traders to plan their entries and exits more effectively. The challenge lies in plotting these levels manually, which can be prone to error. This is where the Custom Fibonacci Retracement Indicator steps in to automate and enhance this process.
The Custom Fibonacci Retracement Indicator: Overview
The Custom Fibonacci Retracement Indicator is designed to streamline the process of plotting Fibonacci levels, making it faster, more accurate, and less prone to human error. It is particularly useful for traders who rely on technical analysis to identify potential support and resistance zones during retracements or pullbacks.
Key Features of the Custom Indicator:
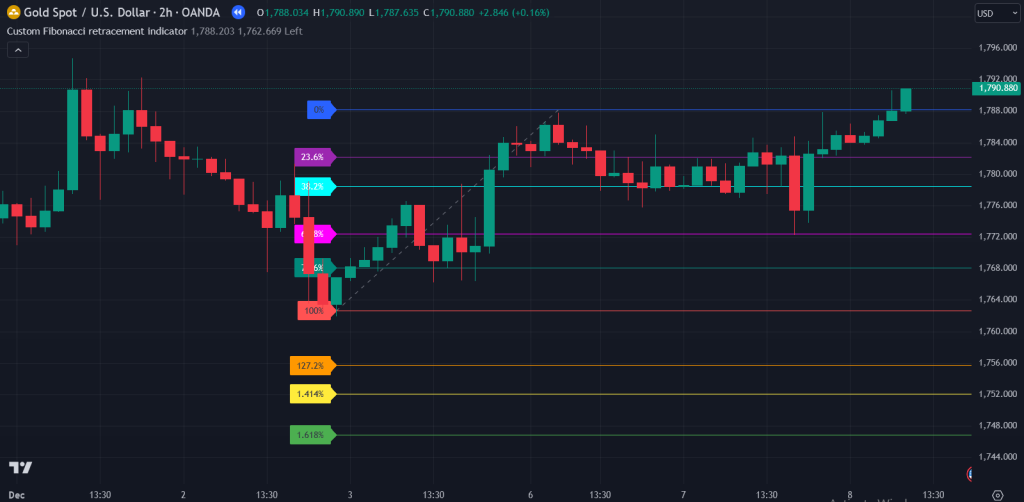
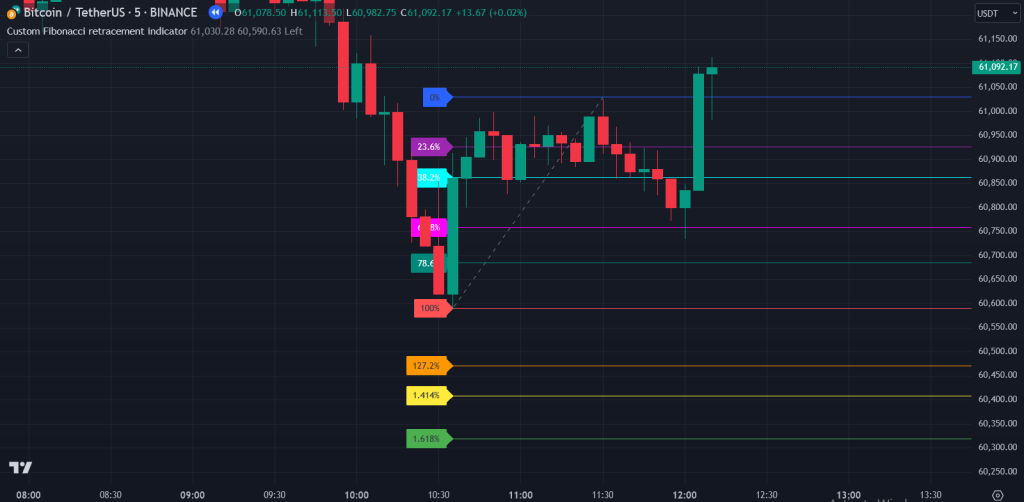
- Automatic Plotting: One of the standout features of the custom Fibonacci retracement indicator is its ability to automatically identify significant high and low points on the chart. Based on these points, the tool calculates and plots Fibonacci levels for you, taking out the guesswork and manual effort.
- Accurate Levels: The indicator ensures that the Fibonacci retracement levels are plotted with precision. This is crucial because even a slight mistake in manually plotting these levels can result in missed trading opportunities or incorrect trade decisions.
- Saves Time: By automating the process, traders no longer need to spend time manually drawing retracement lines. This can be a game-changer for day traders and swing traders who need to react quickly to market movements.
- Customizable Settings: The custom Fibonacci retracement indicator is often equipped with customizable settings, allowing you to adjust the levels based on your trading strategy. You can highlight key Fibonacci levels that are most relevant to your analysis, making the tool adaptable to different market conditions.
- Clear Visualization: The indicator provides clear visualizations of the Fibonacci levels on the chart, making it easy to spot potential support and resistance zones. This clarity allows you to focus on key price levels that could significantly impact your trading decisions.
How the Custom Fibonacci Retracement Indicator Works in TradingView
TradingView is a popular charting platform that allows traders to access a wide range of tools, including custom indicators. The Custom Fibonacci Retracement Indicator can be easily applied to your TradingView charts, enabling seamless integration into your existing analysis process.
Here’s a step-by-step breakdown of how the indicator works:
1. Adding the Indicator
First, open your TradingView chart and navigate to the list of available indicators. Search for the “Custom Fibonacci Retracement Indicator” and add it to your chart. Depending on the version you’re using, the indicator may come pre-installed, or you may need to download it from the TradingView community or the app store.
2. Automatic Plotting of Fibonacci Levels
Once the indicator is added, it will automatically scan the chart to identify the most significant high and low points. Based on these points, it will calculate and plot the Fibonacci retracement levels. This process happens in real-time, so you can see the Fibonacci levels update as new highs and lows form in the market.
3. Focus on Key Levels
With the Fibonacci levels plotted, you can now focus on identifying potential support and resistance zones. These levels are invaluable in determining where price might reverse, pause, or continue its trend. The automatic plotting of these levels ensures you don’t miss any key zones, providing an edge in your trading analysis.
4. Save Time and Increase Efficiency
The Custom Fibonacci Retracement Indicator eliminates the need for manual calculations, allowing you to focus on other aspects of your trading strategy. By saving time, you can analyze more charts and identify more opportunities, whether you’re day trading or swing trading.
Why Use the Custom Fibonacci Retracement Indicator?
In a fast-paced market, every second counts, and traders need tools that allow them to act quickly and decisively. The Custom Fibonacci Retracement Indicator offers several advantages that make it an essential tool for traders:
- Accuracy: By automating the process, the indicator ensures that Fibonacci levels are plotted with pinpoint precision, reducing the chances of human error.
- Speed: Manually plotting Fibonacci levels can take time, especially if you’re analyzing multiple charts. This tool saves you valuable time, allowing you to focus on trading rather than drawing lines.
- Enhanced Analysis: With accurate Fibonacci levels, you can better identify potential areas of support and resistance, improving your decision-making process.
- Adaptability: Whether you’re a swing trader or a day trader, the Custom Fibonacci Retracement Indicator can be customized to fit your strategy and trading style.
Contact to get access for Pinescript code.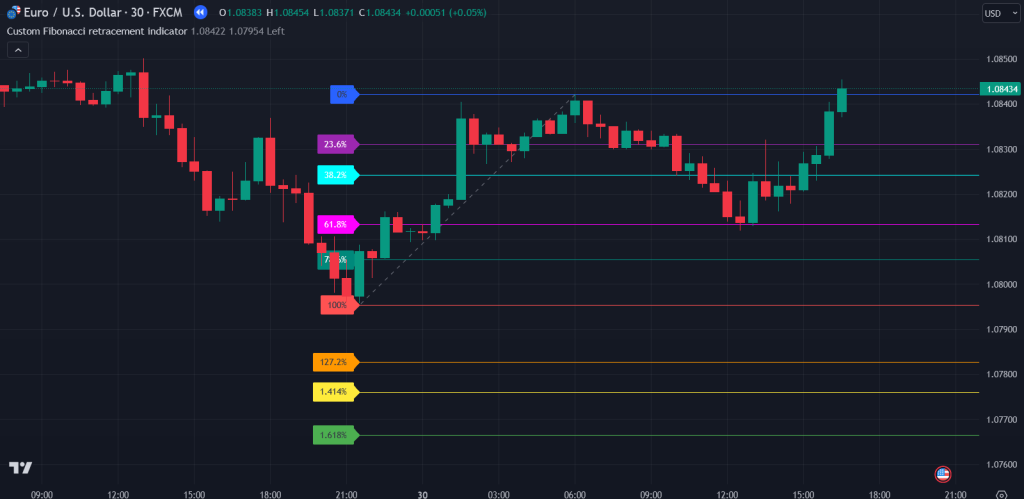
Conclusion
The Custom Fibonacci Retracement Indicator is a powerful tool that can significantly enhance your trading experience. By automating the process of plotting Fibonacci retracement levels, it saves time, improves accuracy, and allows you to focus on making more informed trading decisions. Whether you’re looking to spot potential reversal points or strengthen your analysis of support and resistance zones, this indicator provides the insights you need to succeed in today’s fast-paced markets.
Disclaimer:
The content provided in this post is for educational and informational purposes only and should not be considered as financial, investment, or trading advice. The use of the Custom Fibonacci Retracement Indicator or any other technical analysis tool does not guarantee profits or eliminate the risk of loss. Past performance is not indicative of future results, and trading in financial markets involves significant risk. It is recommended to seek guidance from a licensed financial advisor or perform independent research before making any trading or investment decisions. The author and publisher of this content are not liable for any losses or damages resulting from the use of the information provided. Use at your own risk.

0 Comments