🔓 Get All Tools for FREE!
- ✅ Click here to open a trading account using our referral link and start trading.
- 📅 After 7 days of active trading under our referral link, you can get access to all tools in your account.
- ⚠️ Keep trading to keep access free — if you're inactive for 7 days, your access will be removed.
- 👉 Already have an account? You can change the IB (introducing broker) to our referral link ( https://one.exnesstrack.org/a/w7syl3vnjb ) and still qualify!
In the fast-paced world of trading, effective risk management is crucial for achieving long-term success. One of the most challenging aspects of trading is setting stop loss levels that both protect your capital and allow for normal market fluctuations. Enter the ATR-Based Stop Loss Indicator, a powerful tool that helps traders manage risk by adjusting stop loss levels dynamically based on market volatility. This article delves into what the ATR-Based Stop Loss Indicator is, how it functions in TradingView, and why it is an invaluable asset for traders.
What is the ATR-Based Stop Loss Indicator?
The ATR-Based Stop Loss Indicator is a specialized trading tool that leverages the Average True Range (ATR) to adapt stop loss levels according to market conditions. ATR is a widely used technical indicator that measures the degree of price movement over a given time frame. By calculating the average price range over a specific number of periods, ATR provides insights into market volatility.
For example, if you observe that the ATR value is increasing, it indicates that the asset is experiencing greater price fluctuations. Conversely, a declining ATR suggests that the market is less volatile. The ATR-Based Stop Loss Indicator takes this information and uses it to set stop loss levels that are neither too tight nor too loose. This dynamic adjustment minimizes the likelihood of getting stopped out during normal price fluctuations while also protecting against significant adverse moves.
🔓 Get All Tools for FREE!
- ✅ Click here to open a trading account using our referral link and start trading.
- 📅 After 7 days of active trading under our referral link, you can get access to all tools in your account.
- ⚠️ Keep trading to keep access free — if you're inactive for 7 days, your access will be removed.
- 👉 Already have an account? You can change the IB (introducing broker) to our referral link ( https://one.exnesstrack.org/a/w7syl3vnjb ) and still qualify!
Why Use the ATR-Based Stop Loss Indicator?
- Dynamic Adjustments: Traditional stop loss methods often rely on fixed percentages or dollar amounts, which can lead to premature exits in volatile markets. The ATR-Based Stop Loss Indicator continuously adjusts the stop loss level based on real-time volatility, allowing traders to stay in profitable trades longer.
- Enhanced Risk Management: The indicator provides a more nuanced approach to risk management. By adapting to market conditions, traders can better navigate unexpected price swings without sacrificing their overall trading strategy.
- Flexibility Across Market Conditions: Whether you’re trading stocks, forex, or cryptocurrencies, the ATR-Based Stop Loss Indicator can be customized to fit various market conditions and trading styles. This makes it a versatile tool for traders of all experience levels.
- Combination with Other Indicators: The ATR-Based Stop Loss works exceptionally well in conjunction with other technical indicators, such as Exponential Moving Averages (EMAs). This combination enables traders to identify entry and exit points more effectively while managing their risk.
How Does it Work in TradingView Charts?
Setting up and using the ATR-Based Stop Loss Indicator in TradingView is straightforward. Here’s a step-by-step guide to help you get started:
1. Adding the Indicator
- Open your TradingView account and navigate to the chart of the asset you wish to trade.
- In the search bar at the top of the chart, type “ATR-Based Stop Loss Indicator.”
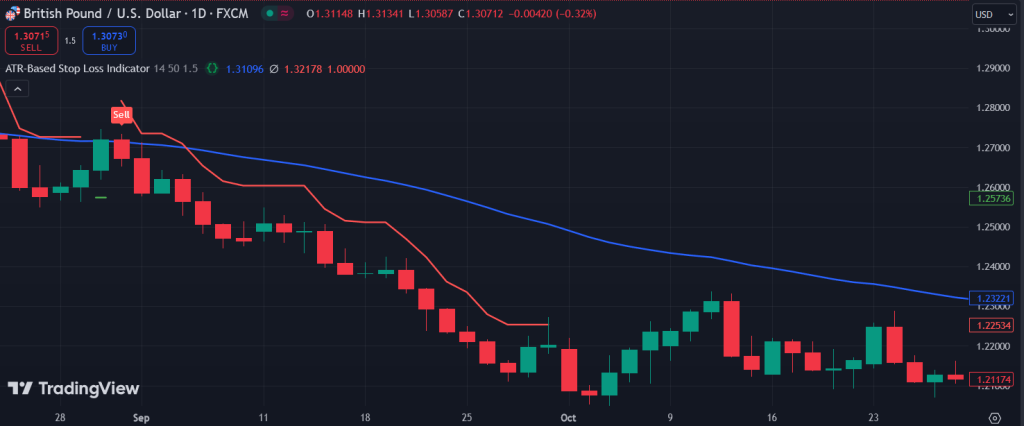
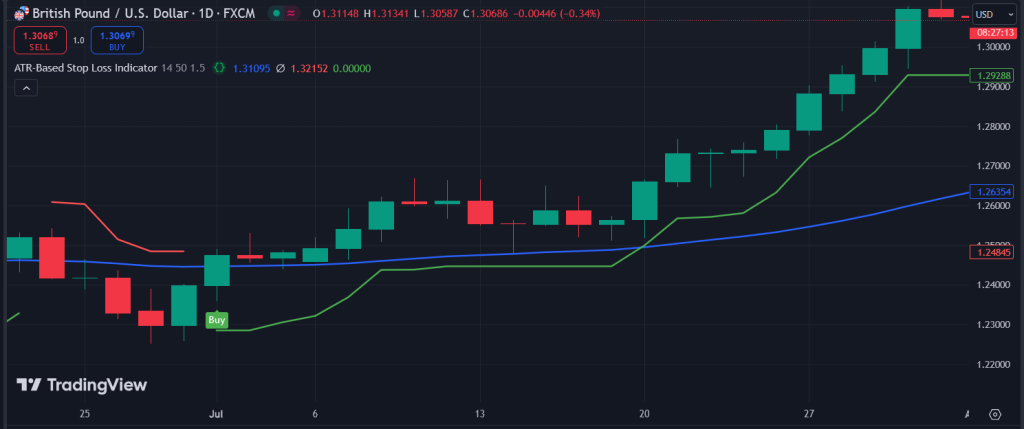
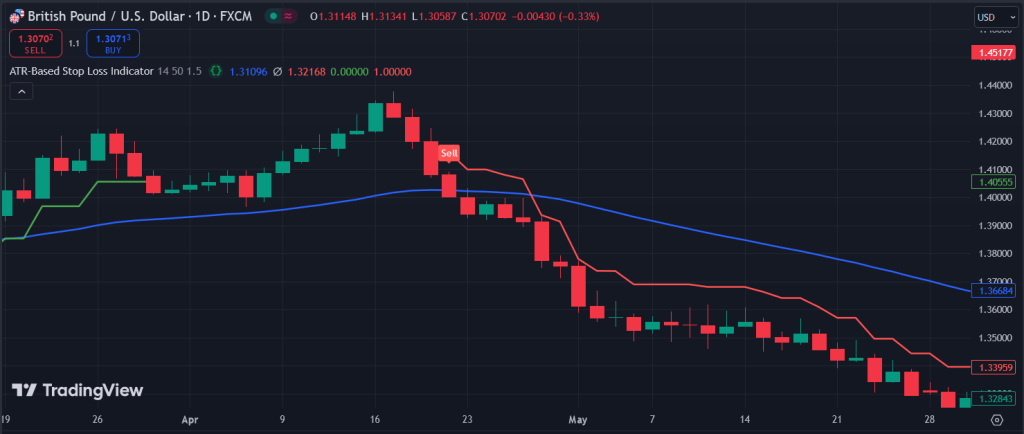
- Select the indicator from the list and add it to your chart. You will see stop loss lines appear above and below the price action.
2. Customizing Settings
- ATR Period: The ATR calculation period can significantly affect its responsiveness. A shorter period (e.g., 10) will react more quickly to price changes, while a longer period (e.g., 14 or 20) may smooth out volatility but lag in responsiveness.
- Multiplier: Most ATR-Based Stop Loss Indicators allow you to set a multiplier for the ATR value. This multiplier can be adjusted to widen or narrow the stop loss range based on your trading style and risk tolerance.
- EMA Settings: If you plan to use EMA signals, set the EMA period according to your strategy. For instance, a 50-period EMA is often used for long-term trends, while a 20-period EMA suits short-term trades.
3. Dynamic Adjustment
Once set up, the ATR-Based Stop Loss Indicator will automatically adjust the stop loss levels in real-time. If volatility increases, the stop loss will widen to allow for more price movement. Conversely, if the market calms, the stop loss tightens, helping secure profits and minimize risk.
4. Enhanced Risk Management
Using the ATR-Based Stop Loss Indicator allows traders to adjust their risk per trade effectively. As the indicator recalibrates the stop loss based on market conditions, you can maintain a consistent risk-to-reward ratio, ensuring that your overall trading strategy remains intact.
5. Performance Monitoring
To maximize the effectiveness of the ATR-Based Stop Loss Indicator, monitor its performance in real-time. Track how well it performs across different market conditions and adjust your settings as needed. Analyzing the indicator’s historical performance can provide insights into how to optimize it for future trades.
Real-World Application
Let’s consider a practical example of how the ATR-Based Stop Loss Indicator can be utilized. Imagine you’re trading a stock that has been relatively stable. As you enter a position, the ATR shows a value of 1.00, indicating low volatility. You set your stop loss using the indicator, which provides a stop loss level that gives your trade some breathing room.
However, after entering your position, the stock price suddenly surges due to unexpected news, causing the ATR to spike to 2.50. The ATR-Based Stop Loss Indicator automatically adjusts your stop loss level to accommodate the increased volatility, preventing your stop loss from being triggered during this price surge. As the stock stabilizes, the ATR decreases, and your stop loss tightens, allowing you to lock in profits while still being protected against adverse price movements.
Pinescript for "ATR-Based Stop Loss Indicator"

//@version=5
indicator("ATR-Based Stop Loss Indicator", overlay=true)

// Input for ATR and EMA lengths
atrLength = input.int(14, title="ATR Length", minval=1)
emaLength = input.int(50, title="EMA Length", minval=1)
multiplier = input.float(1.5, title="ATR Multiplier", minval=0.1)

// Calculate ATR and EMA
atr = ta.atr(atrLength)
ema = ta.ema(close, emaLength)

// Variables to store trailing stop levels
var float trailingStopLong = na
var float trailingStopShort = na

// Conditions for buy/sell signals based on EMA crossover
buySignal = ta.crossover(close, ema)
sellSignal = ta.crossunder(close, ema)

// Trailing Stop Logic for Long Trades
if (buySignal)
    // Initialize the stop loss for a new long trade
    trailingStopLong := close - atr * multiplier
else if (close > ema and not na(trailingStopLong))
    // Update the trailing stop only when the price rises
    trailingStopLong := math.max(trailingStopLong, close - atr * multiplier)

// Trailing Stop Logic for Short Trades
if (sellSignal)
    // Initialize the stop loss for a new short trade
    trailingStopShort := close + atr * multiplier
else if (close < ema and not na(trailingStopShort))
    // Update the trailing stop only when the price falls
    trailingStopShort := math.min(trailingStopShort, close + atr * multiplier)


// Variables to handle buy/sell triggers and SL/TP logic
var buyTrigger = true
var sellTrigger = true

var buy_sl  = 0.0
var sell_sl  = 0.0

// Handle SL/TP for Buy
if buySignal
    buyTrigger := false
    sellTrigger := true
    buy_sl := trailingStopLong
    sell_sl := 0

// Handle SL/TP for Sell
if sellSignal
    sellTrigger := false
    buyTrigger := true
    buy_sl := 0
    sell_sl := trailingStopShort

if buy_sl != 0
    buy_sl := trailingStopLong

if sell_sl != 0
    sell_sl := trailingStopShort

// Plot EMA on the chart
plot(ema, color=color.blue, linewidth=2, title="EMA")

// Plot Trailing Stop Levels
plot(buy_sl != 0 ? buy_sl : na, color=buy_sl != 0 ? color.green : chart.bg_color, linewidth=2, title="Trailing ATR Stop Loss (Long)",style = plot.style_linebr)
plot(sell_sl != 0 ? sell_sl : na , color=sell_sl != 0 ? color.red : chart.bg_color, linewidth=2, title="Trailing ATR Stop Loss (Short)",style = plot.style_linebr)


// Plot Buy and Sell signals
plotshape(buySignal, style=shape.labelup, location=location.belowbar, color=color.green, size=size.tiny, title="Buy", text="Buy", textcolor=color.white)
plotshape(sellSignal, style=shape.labeldown, location=location.abovebar, color=color.red, size=size.tiny, title="Sell", text="Sell", textcolor=color.white)

// Alerts
alertcondition(buySignal, title="Buy Alert", message="Buy Signal with Trailing ATR Stop Loss")
alertcondition(sellSignal, title="Sell Alert", message="Sell Signal with Trailing ATR Stop Loss")

// Check for Stop Loss
buy_sl_hit = (ta.crossunder(low, buy_sl) or low <= buy_sl) and buy_sl > 0

if buy_sl_hit
    buy_sl := 0

sell_sl_hit = (ta.crossover(high, sell_sl) or high >= sell_sl) and sell_sl > 0

if sell_sl_hit
    sell_sl := 0
Conclusion
The ATR-Based Stop Loss Indicator is an invaluable tool for traders looking to enhance their risk management strategies. By dynamically adjusting stop loss levels based on market volatility, it provides traders with the flexibility to navigate different market conditions effectively. Whether you’re a novice or an experienced trader, integrating this indicator into your TradingView setup can significantly improve your trading outcomes.
Disclaimer
The information provided in this article regarding the ATR-Based Stop Loss Indicator and its usage in TradingView is for educational purposes only. It does not constitute financial advice, trading recommendations, or endorsements of any trading strategy. Trading involves significant risk, and it is possible to lose all or a portion of your investment.
0 Comments