🔓 Get All Tools for FREE!
- ✅ Click here to open a trading account using our referral link and start trading.
- 📅 After 7 days of active trading under our referral link, you can get access to all tools in your account.
- ⚠️ Keep trading to keep access free — if you're inactive for 7 days, your access will be removed.
- 👉 Already have an account? You can change the IB (introducing broker) to our referral link ( https://one.exnesstrack.org/a/w7syl3vnjb ) and still qualify!
In the world of trading, identifying whether a market is trending or moving sideways is crucial for making informed decisions. One of the most effective tools for determining the strength of a trend is the ADX (Average Directional Index) Trend Strength Indicator. This technical analysis tool helps traders distinguish between strong and weak trends, allowing them to maximize their trading opportunities while avoiding range-bound or low-momentum markets. In this guide, we’ll explore the ADX indicator, how it works, and how you can use it effectively in your trading strategy.
What is the ADX Trend Strength Indicator?
The ADX (Average Directional Index) is a popular technical indicator developed by J. Welles Wilder in 1978. It’s part of the larger Directional Movement System (DMI), which includes two additional lines: the +DI (Positive Directional Index) and -DI (Negative Directional Index). While the DMI lines indicate the direction of the market, the ADX focuses solely on measuring the strength of a trend, regardless of its direction.
The ADX operates on a scale of 0 to 100, where higher values indicate stronger trends, and lower values indicate weaker trends or sideways markets. However, it doesn’t tell you whether the trend is bullish or bearish—it simply measures how strong the current trend is. Traders often use the ADX in conjunction with other technical indicators to determine both the direction and strength of a trend, making it a versatile tool for many trading strategies.
🔓 Get All Tools for FREE!
- ✅ Click here to open a trading account using our referral link and start trading.
- 📅 After 7 days of active trading under our referral link, you can get access to all tools in your account.
- ⚠️ Keep trading to keep access free — if you're inactive for 7 days, your access will be removed.
- 👉 Already have an account? You can change the IB (introducing broker) to our referral link ( https://one.exnesstrack.org/a/w7syl3vnjb ) and still qualify!
Why Use the ADX Indicator?
The primary purpose of the ADX indicator is to help traders avoid trading in range-bound or sideways markets. These periods of low volatility can be frustrating for trend traders, as price movements lack clear direction, making it difficult to profit from market swings. By using the ADX, traders can focus on markets that are experiencing strong trends, whether upward or downward, and avoid the noise and uncertainty of weak or choppy markets.
Here are a few key benefits of using the ADX indicator:
- Identifies Trend Strength: The ADX helps determine whether the market is in a strong trend, providing insight into the market’s potential for significant price movement.
- Avoids Sideways Markets: A low ADX value indicates a range-bound market, allowing traders to avoid entering positions when there’s a lack of momentum.
- Complementary to Other Indicators: When used with other tools like moving averages or oscillators, the ADX becomes even more powerful, offering a complete picture of market conditions.
- Works in All Markets: The ADX indicator can be applied to any market—stocks, forex, commodities, and more—making it a flexible tool for all types of traders.
How the ADX Indicator Works
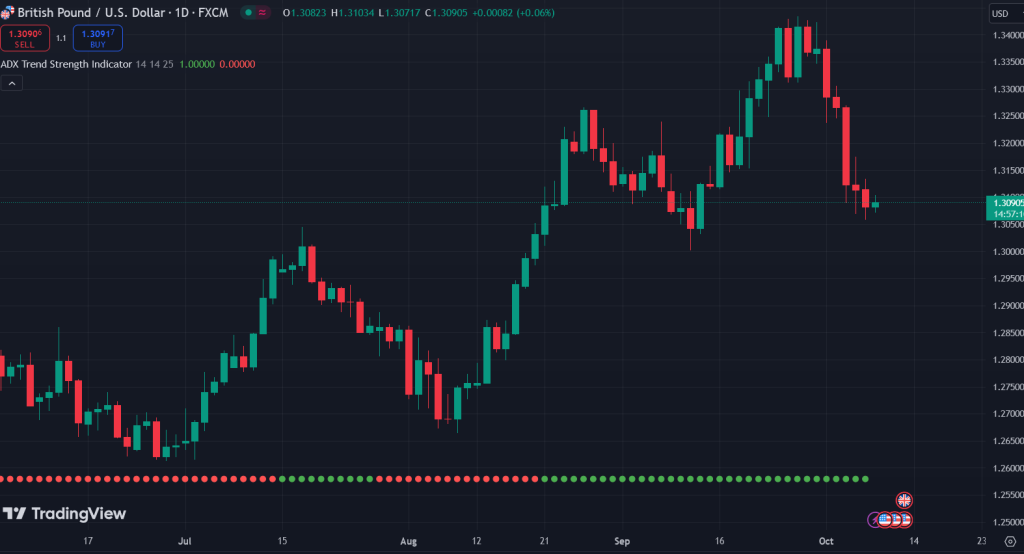
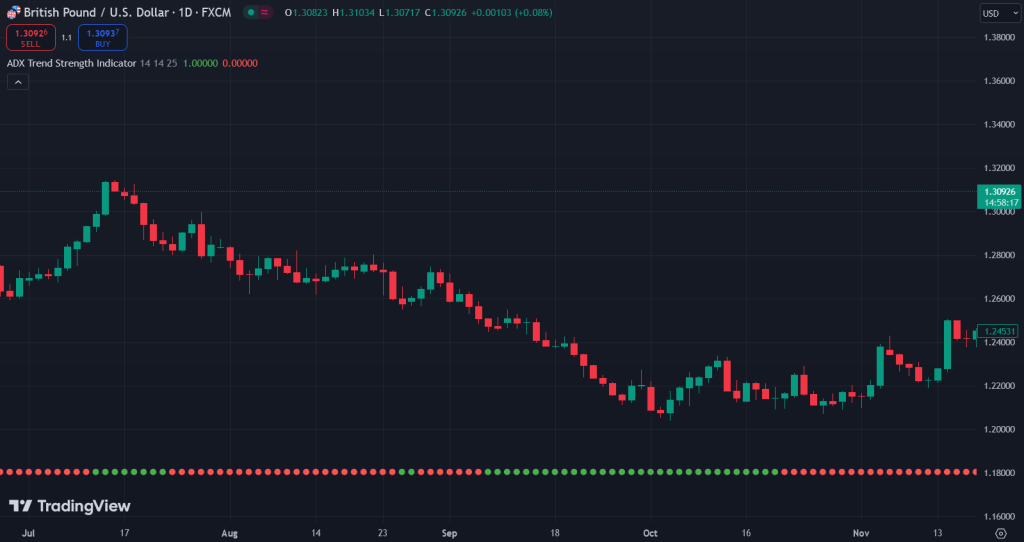
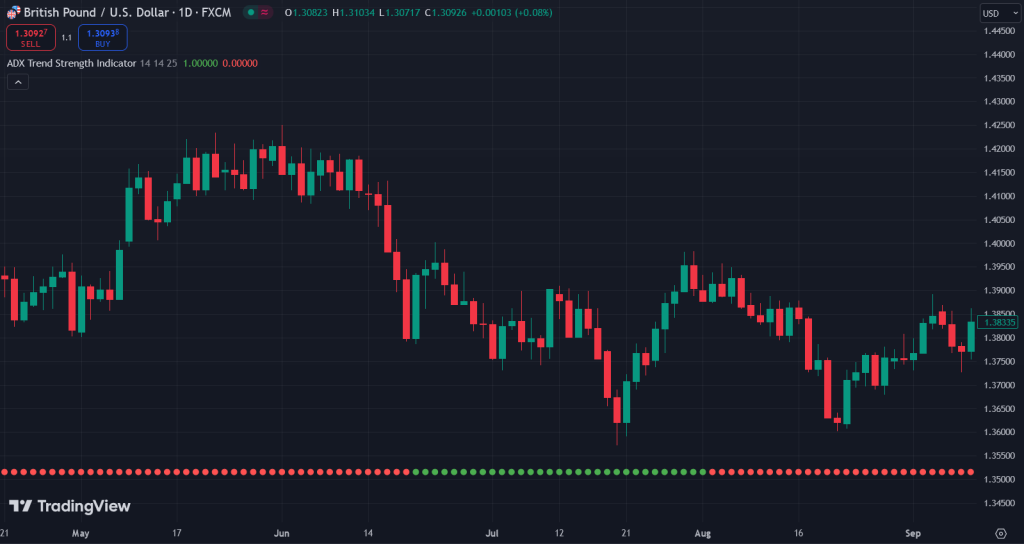
The ADX indicator measures trend strength without considering the direction of the trend. Here’s how it works on TradingView charts and how you can interpret it effectively:
- ADX > 25: Strong Trend
- When the ADX value is above 25, it signals that the market is experiencing a strong trend. This can be either bullish or bearish, but the important takeaway is that prices are likely moving with momentum. In TradingView, the ADX line may turn green when it crosses this threshold, making it easy to spot when a strong trend is underway.
- ADX < 25: Weak Trend or Sideways Market
- When the ADX value drops below 25, the market is likely in a weak trend or moving sideways, lacking clear direction. The ADX line may turn red in this case, signaling that traders should be cautious or avoid entering new trades, as there may not be enough momentum for a profitable move.
- ADX Between 20 and 25: Consolidation Phase
- In some cases, the ADX may hover between 20 and 25, indicating a period of consolidation where the market is gathering strength. While this range doesn’t necessarily indicate a strong trend, it may suggest that a significant move is about to happen. Traders can watch for a breakout when the ADX rises above 25.
- ADX Above 50: Extremely Strong Trend
- If the ADX crosses above 50, it signifies an extremely strong trend, where price movements are more likely to be sustained over a longer period. This is often seen during periods of high volatility, such as after major economic news or geopolitical events.
- ADX Divergence
- Traders can also look for divergences between price action and the ADX line. For example, if the ADX is rising while prices are moving sideways, it could indicate that the market is about to enter a strong trend. Conversely, if the ADX is falling while prices are trending, it may suggest that the trend is losing momentum.
Using ADX in Your Trading Strategy
The ADX can be a powerful addition to your trading strategy when used correctly. Here are a few ways you can incorporate the ADX into your trading decisions:
- Identify Entry and Exit Points:
- Use the ADX to confirm whether a trend is strong enough to enter a trade. For example, if you’re considering buying a stock or currency pair, make sure the ADX is above 25 to ensure that the market has enough momentum to carry the trade in your favor. Similarly, if the ADX falls below 25, it may be a signal to exit the trade, as the trend is losing strength.
- Combine with Moving Averages:
- One effective strategy is to combine the ADX with moving averages. For example, if a moving average crossover suggests a buy signal, check the ADX to confirm that the trend is strong enough to support the trade. If the ADX is below 25, it might be wise to wait until momentum picks up before entering the position.
- Pair with Oscillators:
- Oscillators like the RSI (Relative Strength Index) or MACD (Moving Average Convergence Divergence) can help you determine whether a trend is overbought or oversold. Use the ADX to confirm the strength of the trend before making your move. For instance, if the RSI indicates that a stock is overbought but the ADX is still rising above 25, it could mean that the trend has more room to run.
- Set Stop Losses:
- The ADX can also help you set stop-loss levels. If the ADX starts falling after a strong trend, it may be time to tighten your stop-loss orders, as the market could be losing momentum and heading into a range-bound phase.
Pinescript for "ADX Trend Strength Indicator"

//@version=5
// insta id algo_aakash
indicator("ADX Trend Strength Indicator", overlay=true)

// Input for ADX length and smoothing
adxLength = input.int(14, title="ADX Length", minval=1)
adxSmoothing = input.int(14, title="ADX Smoothing", minval=1)
threshold = input(25, title="ADX Threshold")

// Calculate ADX with smoothing
[_, _, adx] = ta.dmi(adxLength, adxSmoothing)

// Background color based on ADX value
//Optional
//bgcolor(adx > threshold ? color.new(color.green, 90) : color.new(color.red, 90))

// Determine a fixed position for the circles (adjust this value as needed)
circleY = 10  // Y position for the circle

// Plot circles at a fixed position based on ADX condition

plotshape(adx > threshold, title='Strong Trend Signal', style=shape.circle, location=location.bottom, color=color.new(color.green,0), offset=-1, size=size.tiny )
plotshape(adx < threshold, title='Strong Trend Signal', style=shape.circle, location=location.bottom, color=color.new(color.red,0), offset=-1, size=size.tiny )
Conclusion
The ADX Trend Strength Indicator is an essential tool for any trader looking to identify strong trends and avoid weak or sideways markets. Its ability to measure trend strength without considering direction makes it versatile and applicable to any market, whether you’re trading stocks, forex, or commodities. By understanding how the ADX works and incorporating it into your trading strategy, you can make more informed decisions and increase your chances of success.
Disclaimer:
The content provided in this video and accompanying material is for educational purposes only and should not be considered as financial or investment advice. Trading in financial markets involves substantial risk, and you may lose more than your initial investment. It is important to understand the risks involved and seek advice from a qualified financial advisor if necessary. Past performance is not indicative of future results, and you should conduct your own research or consult with a professional before making any trading decisions. We are not liable for any financial losses incurred based on the use of this information.
0 Comments