🔓 Get All Tools for FREE!
- ✅ Click here to open a trading account using our referral link and start trading.
- 📅 After 7 days of active trading under our referral link, you can get access to all tools in your account.
- ⚠️ Keep trading to keep access free — if you're inactive for 7 days, your access will be removed.
- 👉 Already have an account? You can change the IB (introducing broker) to our referral link ( https://one.exnesstrack.org/a/w7syl3vnjb ) and still qualify!
What is the Swing Highs Lows with Candle Patterns Tradingview Indicator?
In the world of trading, accurately identifying key price points, trends, and reversal signals is crucial for making informed decisions. One effective way to achieve this is through indicators, which provide visual cues on price charts. In this article, we will explore an innovative TradingView indicator built using Pine Script that identifies Swing Highs and Swing Lows, as well as common candlestick patterns. This tool helps traders gain insights into market trends, potential reversals, and entry or exit points.
Explanation of the Indicator:
This Pine Script indicator was designed to provide clarity and actionable insights by identifying Swing Highs and Swing Lows, alongside detecting common candlestick patterns. It offers traders a comprehensive view of the market, combining the power of price action analysis with popular candlestick charting techniques. The indicator has several features that are easy to use and fully customizable.
🔓 Get All Tools for FREE!
- ✅ Click here to open a trading account using our referral link and start trading.
- 📅 After 7 days of active trading under our referral link, you can get access to all tools in your account.
- ⚠️ Keep trading to keep access free — if you're inactive for 7 days, your access will be removed.
- 👉 Already have an account? You can change the IB (introducing broker) to our referral link ( https://one.exnesstrack.org/a/w7syl3vnjb ) and still qualify!
How Swing Highs Lows with Candle Patterns Indicator Works on Tradingview
The indicator works in two key ways: by identifying Swing Highs and Swing Lows and detecting various candlestick patterns. Here’s a deeper look at how each feature functions:
Swing Highs and Swing Lows:
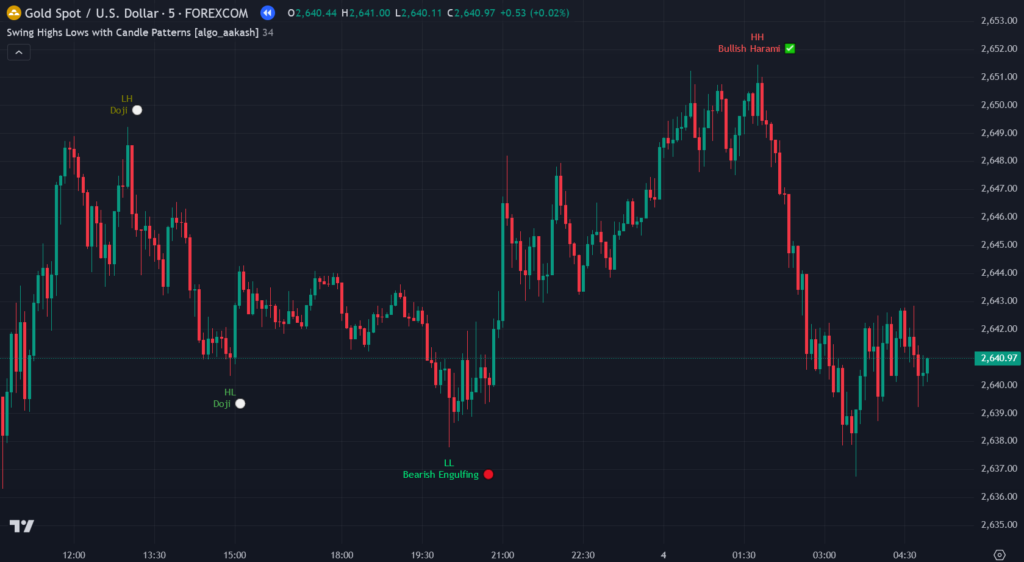
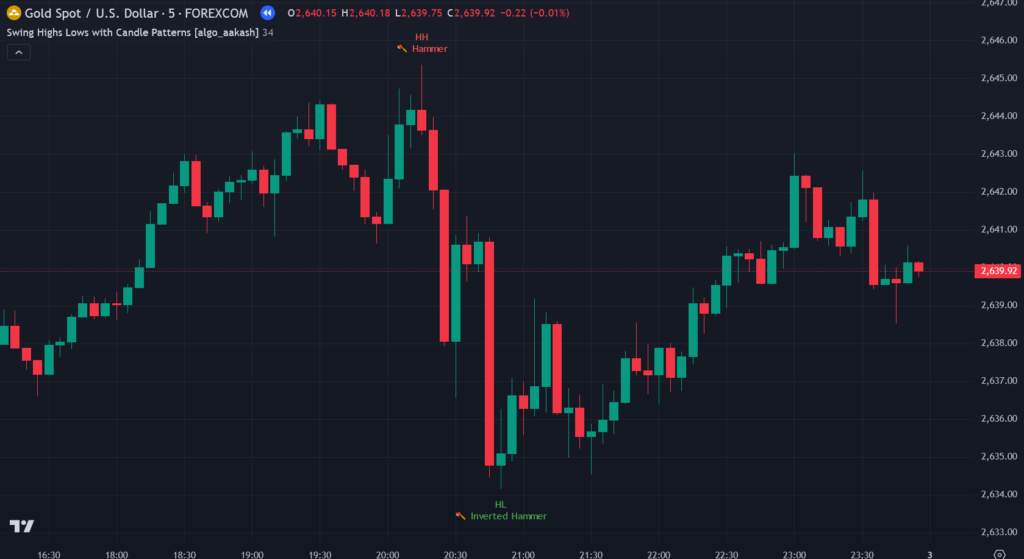
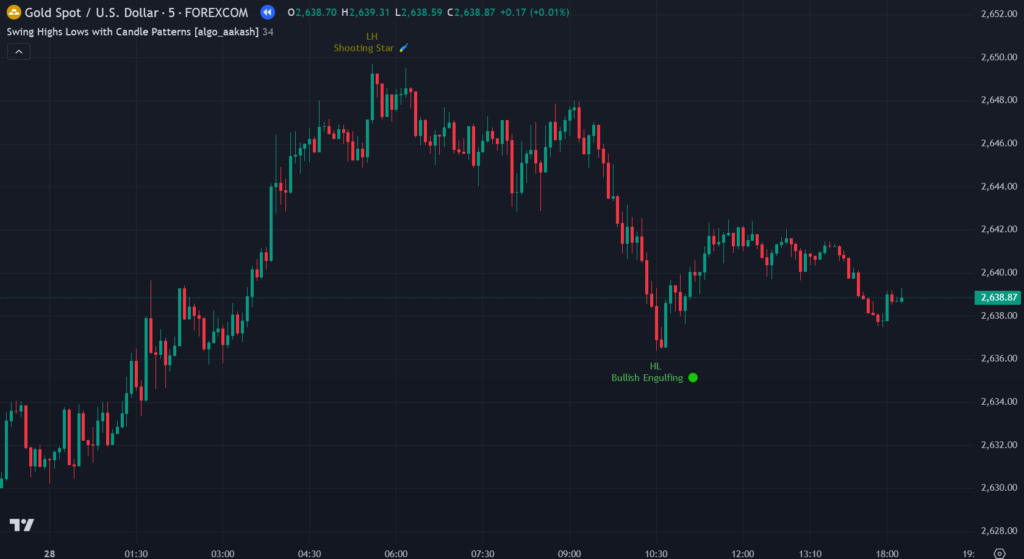
The core feature of this indicator is its ability to calculate and mark Swing Highs and Swing Lows. These are crucial price points that can signal trend changes or confirm the continuation of a current trend. The indicator automatically detects and plots these swings based on a pivot length (which can be customized, with the default being 34 bars).
- Higher Highs (HH): These are the highest price points reached in an uptrend. When the current price exceeds the previous swing high, it is marked as a higher high.
- Lower Highs (LH): In a downtrend, a lower high forms when the price fails to exceed the previous high, marking a potential continuation or consolidation.
- Higher Lows (HL): A higher low marks the price point where the market experiences a pullback during an uptrend but doesn’t drop below the previous low, indicating strength.
- Lower Lows (LL): In a downtrend, a lower low is formed when the price falls below the previous low, signaling that the downtrend may continue.
By identifying these key swings, the indicator provides traders with the context they need to determine the strength and direction of the trend. This is especially useful for identifying potential trend reversals or continuations.
Candlestick Patterns:
In addition to marking swing points, this indicator also detects and labels various candlestick patterns. These patterns are widely used by traders to assess market sentiment and predict future price movements. The indicator identifies the following patterns:
- Doji: A candlestick with a small body and long wicks, signaling market indecision.
- Evening Star: A bearish reversal pattern that occurs after an uptrend.
- Morning Star: A bullish reversal pattern that occurs after a downtrend.
- Shooting Star: A bearish reversal pattern with a small body and a long upper wick.
- Hammer: A bullish reversal pattern found at the bottom of a downtrend.
- Inverted Hammer: A bullish reversal pattern found at the bottom of a downtrend, similar to a hammer but with the wick above the body.
- Bearish Harami: A two-candle pattern indicating a potential bearish reversal.
- Bullish Harami: A two-candle pattern indicating a potential bullish reversal.
- Bearish Engulfing: A two-candle pattern where a large bearish candle fully engulfs the preceding smaller bullish candle, signaling a potential reversal to the downside.
- Bullish Engulfing: A two-candle pattern where a large bullish candle engulfs the preceding smaller bearish candle, signaling a potential reversal to the upside.
These candlestick patterns give traders insight into the market’s psychology and sentiment, which can help forecast potential price movements.
Features of the Indicator:
The indicator is packed with several features that enhance its usability and flexibility for traders. Some key features include:
- Customizable Colors: Traders can customize the colors for each type of swing (higher high, lower high, higher low, lower low). This feature allows for a personalized charting experience and makes it easier to distinguish between different swing points.
- Candlestick Pattern Labels: The indicator labels the detected candlestick patterns directly on the chart. These labels help traders quickly identify potential reversal signals and take appropriate actions.
- Swing Context: The indicator not only identifies swings but also distinguishes between higher and lower swings to provide additional context for trend analysis. This helps traders identify whether the market is in a bullish or bearish trend and adjust their strategies accordingly.
- Trend Confirmation: By combining swing points and candlestick patterns, the indicator offers valuable information to confirm the strength of a trend or signal potential trend changes. This allows traders to make more confident decisions based on the prevailing market conditions.
How It’s Useful:
This TradingView indicator is designed to improve decision-making by providing key insights into market movements. Here’s how it proves useful for traders:
1. Identifying Potential Trend Reversals or Continuations:
The combination of Swing Highs, Swing Lows, and candlestick patterns is a powerful tool for spotting trend reversals or confirming trend continuations. For example, when a higher high is followed by a higher low, it indicates that the uptrend is likely to continue. On the other hand, when a lower high and a lower low are detected, it signals the potential continuation of a downtrend.
Candlestick patterns such as Bullish Engulfing or Morning Star can further confirm these trend changes, giving traders an added layer of confidence in their decisions.
2. Recognizing Market Sentiment:
The detected candlestick patterns serve as an excellent way to gauge market sentiment. For instance, a Doji pattern suggests indecision, while a Shooting Star signals bearish sentiment, especially after an uptrend. These signals can help traders align their strategies with the prevailing market mood.
3. Visual Cues for Entry and Exit Points:
Traders can use the marked Swing Highs, Swing Lows, and candlestick patterns as visual cues for identifying entry and exit points. For instance, a bullish pattern like Hammer or Bullish Engulfing at a Swing Low can serve as a strong signal to enter a long trade. Conversely, a Bearish Engulfing pattern at a Swing High could signal a good time to exit or short the market.
Conclusion:
Incorporating this Pine Script indicator into your TradingView charting setup offers valuable insights into market trends and price movements. By automatically detecting Swing Highs and Swing Lows and labeling key candlestick patterns, the indicator gives traders the tools they need to identify trend reversals, confirm trends, and spot potential entry and exit points. Whether you’re a beginner or an experienced trader, this indicator is a powerful tool for making more informed trading decisions.
Pinescript of Swing Highs Lows with Candle Patterns Tradingview Indicator
For access to this indicator, reach out to us at +91 7620658346. We specialize in developing algorithms for TradingView, MT4/MT5, and trading bots.
Follow @algo_aakash on Instagram, YouTube, and Twitter for updates!
Disclaimer
The information in this article and any associated indicators is intended for educational purposes only. Trading in financial markets involves significant risk, and there is no assurance of profit. The custom Bollinger Band strategy is based on historical data and technical analysis, which may not accurately forecast future market trends. Users are encouraged to perform their own research, evaluate their risk tolerance, and seek guidance from a licensed financial advisor before making any trading decisions. The author and developer of this indicator are not liable for any losses resulting from the use of this strategy. Trade responsibly.
🔓 Get This Tool for FREE!
- ✅ Click here to open a trading account using our referral link and start trading.
- 💡 Use coupon code: FREE during checkout.
- 📅 After 7 days of active trading under our referral link, you’ll get access to this tool in your account.
- ⚠️ Keep trading to keep access free — if you're inactive for 7 days, your access will be removed.
- 👉 Already have an account? You can change the IB (introducing broker) to our referral link and still qualify!

1 Comment
Manisha baban kamble · December 24, 2024 at 8:28 am
Very good indicator