🔓 Get All Tools for FREE!
- ✅ Click here to open a trading account using our referral link and start trading.
- 📅 After 7 days of active trading under our referral link, you can get access to all tools in your account.
- ⚠️ Keep trading to keep access free — if you're inactive for 7 days, your access will be removed.
- 👉 Already have an account? You can change the IB (introducing broker) to our referral link ( https://one.exnesstrack.org/a/w7syl3vnjb ) and still qualify!
What is the Support & Resistance zones and detects RSI Divergences Indicator?
In the world of technical analysis, indicators are tools traders use to interpret price data and make informed decisions. On TradingView, a popular platform for charting and trading, indicators play a crucial role in identifying potential trade setups and market trends. One standout tool is the Support & Resistance Zones with RSI Divergence Indicator. Let’s dive deeper into what this indicator is and how it works on TradingView, leveraging the powerful scripting language Pine Script to enhance your trading strategy.
Explanation of the Indicator:
The Support & Resistance Zones with RSI Divergence Indicator is a multi-functional tool that simplifies complex analysis into actionable signals. Here’s how it functions:
🔓 Get All Tools for FREE!
- ✅ Click here to open a trading account using our referral link and start trading.
- 📅 After 7 days of active trading under our referral link, you can get access to all tools in your account.
- ⚠️ Keep trading to keep access free — if you're inactive for 7 days, your access will be removed.
- 👉 Already have an account? You can change the IB (introducing broker) to our referral link ( https://one.exnesstrack.org/a/w7syl3vnjb ) and still qualify!
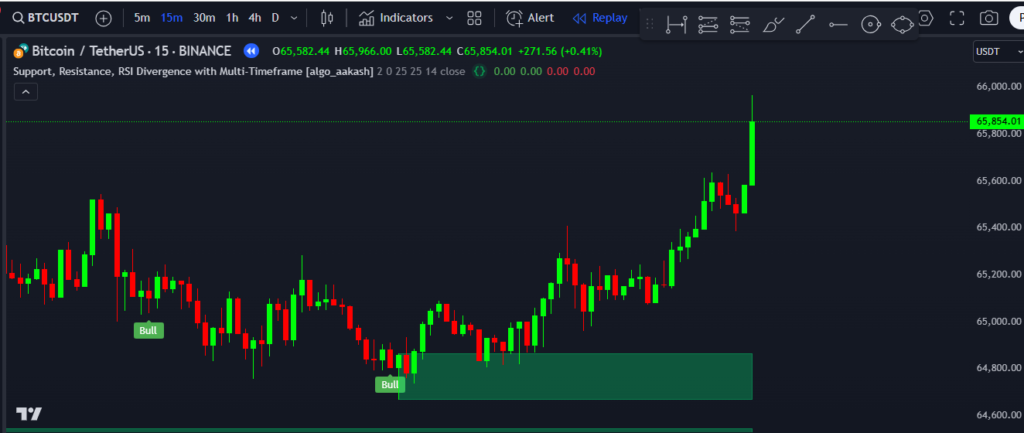
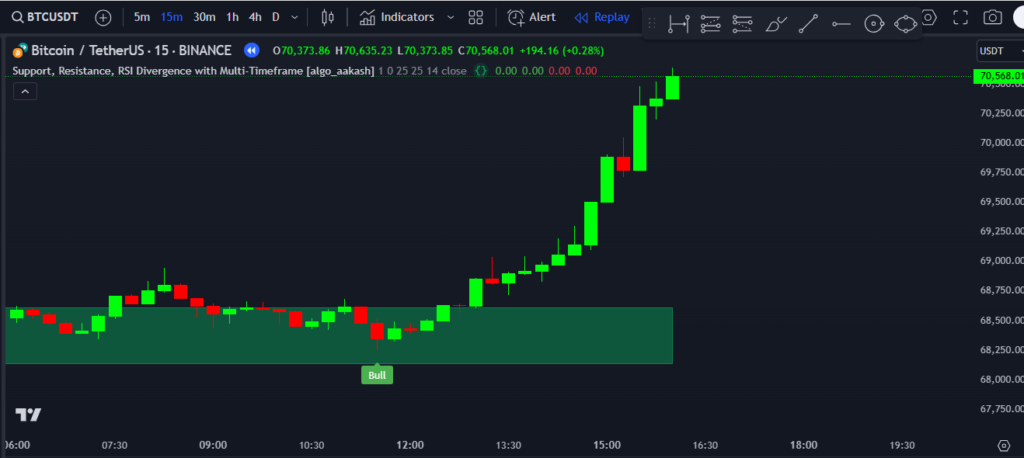
- Support & Resistance Zones: The indicator automatically identifies key price levels where the market tends to reverse. These zones are essential for understanding where buyers and sellers are likely to step in, making them critical for trade entry and exit.
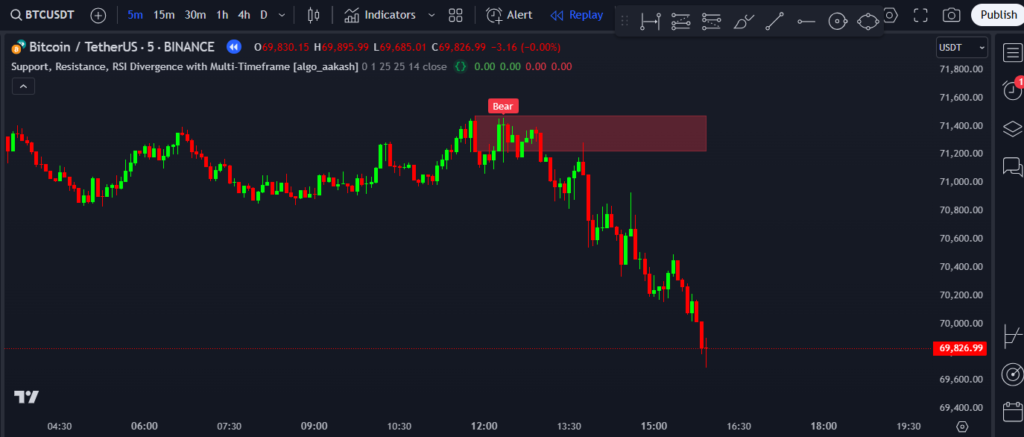
- RSI Divergence Signals: The Relative Strength Index (RSI) is a momentum oscillator that measures the speed and change of price movements. This indicator takes it a step further by identifying bullish divergences near support zones (indicating a potential upward move) and bearish divergences near resistance zones (signaling a possible price drop).
- Multi-Timeframe Analysis: Trading across different timeframes can be overwhelming. This indicator aggregates data from multiple timeframes, ensuring you have a broader market perspective and never miss a trade setup.
How Support & Resistance zones and detects RSI Divergences Indicator Works on TradingView:
TradingView makes technical analysis accessible to traders of all levels. This platform is not only user-friendly but also customizable, thanks to its proprietary scripting language, Pine Script. Here’s how the Support & Resistance Zones with RSI Divergence Indicator works on TradingView:
1. Setup and Application
- Once you’ve logged into TradingView, navigate to the “Indicators” tab and search for the specific indicator. If the indicator is custom-built using Pine Script, you can import it by copying the Pine Script code into the Pine Editor.
- After adding the indicator to your chart, it will automatically plot support and resistance zones, highlight RSI divergences, and display signals for potential trade setups.
2. Support & Resistance Zones
- The indicator uses historical price data to identify zones where price has frequently reversed in the past. These levels are dynamically updated as the market evolves, ensuring they remain relevant.
- By focusing on these zones, traders can anticipate market behavior, setting stop losses and take-profit levels more effectively.
3. RSI Divergence Detection
- The RSI component of the indicator scans for divergence patterns. A bullish divergence occurs when the price makes a lower low while the RSI makes a higher low near a support zone, suggesting upward momentum.
- Conversely, a bearish divergence happens when the price makes a higher high but the RSI forms a lower high near a resistance zone, indicating potential downward pressure.
4. Multi-Timeframe Analysis
- One of the standout features is its ability to incorporate data from multiple timeframes. For example, you could track a 15-minute chart’s support zones while simultaneously monitoring RSI divergence on an hourly chart. This ensures you’re always trading with the bigger picture in mind.
Why Use This Indicator?
Combining support and resistance levels with RSI divergence and multi-timeframe analysis offers a comprehensive approach to trading. Here are some key benefits:
- Enhanced Accuracy: The indicator’s automated analysis reduces human error, allowing you to focus on execution rather than calculation.
- Time Efficiency: Multi-timeframe capabilities mean you spend less time switching between charts and more time making decisions.
- Customizability with Pine Script: If you’re familiar with Pine Script, you can tweak the indicator to suit your trading style, such as adjusting sensitivity or adding alerts for specific conditions.
How to Get Started:
- Accessing the Indicator on TradingView
- If the indicator is pre-built, simply search for it in the TradingView library. For custom-built indicators, open the Pine Editor and paste the code. Save and add it to your chart.
- Understanding Pine Script
- Pine Script is a lightweight coding language that makes it easy to create custom indicators and strategies. With just a few lines of code, you can add personalized features to the Support & Resistance Zones with RSI Divergence Indicator.
- Practical Application
- Start with a demo account to test the indicator’s signals. Practice identifying key support and resistance zones, analyzing RSI divergence patterns, and using multi-timeframe data.
Conclusion:
TradingView’s Support & Resistance Zones with RSI Divergence Indicator is a powerful tool for traders aiming to enhance their technical analysis. By automating critical tasks like zone identification, divergence detection, and multi-timeframe analysis, it simplifies the trading process while improving accuracy. Whether you’re a beginner or an advanced trader, leveraging Pine Script to customize this indicator can give you a competitive edge in the markets. Embrace this innovative tool on TradingView to refine your strategy and achieve your trading goals.
Pinescript of Support & Resistance zones and detects RSI Divergences Indicatoriple timeframes Indicator
Get access to this powerful indicator by contacting us at +91 7620658346. We specialize in creating custom algorithms for TradingView, MT4/MT5, and trading bots.
Follow @algo_aakash on Instagram, YouTube, and Twitter to stay updated.
Disclaimer
The content provided in this article and any associated indicators is for educational purposes only. Trading in financial markets involves significant risk, and there is no guarantee of profit. TSupport & Resistance zones and detects RSI Divergences Indicator, which may not predict future market movements. Users are advised to conduct their own research, evaluate their risk tolerance, and consult with a licensed financial advisor before making any trading decisions. The author and developer of this indicator are not responsible for any losses incurred through its use. Please trade responsibly.
0 Comments