🔓 Get All Tools for FREE!
- ✅ Click here to open a trading account using our referral link and start trading.
- 📅 After 7 days of active trading under our referral link, you can get access to all tools in your account.
- ⚠️ Keep trading to keep access free — if you're inactive for 7 days, your access will be removed.
- 👉 Already have an account? You can change the IB (introducing broker) to our referral link ( https://one.exnesstrack.org/a/w7syl3vnjb ) and still qualify!
The Support Resistance Zone indicator is a powerful tool used by traders to identify key levels in the market where price action is likely to reverse or consolidate. By understanding these levels, traders can make informed decisions about potential trade entries and exits. This article will explore how the Support Resistance Zone indicator works on TradingView, how it is used to enhance technical analysis, and why it is a valuable tool for traders using PineScript.
What is the Support Resistance Zone Indicator?
The Support Resistance Zone indicator is designed to highlight the price levels where the market has previously reversed or shown signs of consolidation. These levels are essential for technical traders because they act as boundaries where price is likely to react. Support levels represent the price level at which a downtrend may stall or reverse, while resistance levels indicate where an uptrend could face a potential barrier.
The indicator plots these zones directly on the chart, making it easier for traders to spot these critical price levels. By using TradingView, traders can customize the indicator to suit their needs, whether they are analyzing long-term trends or shorter intraday movements.
How Does the Indicator Work on TradingView?
The Support Resistance Zone indicator utilizes a methodical approach to calculate support and resistance levels. The way it functions can be broken down into several key steps:
🔓 Get All Tools for FREE!
- ✅ Click here to open a trading account using our referral link and start trading.
- 📅 After 7 days of active trading under our referral link, you can get access to all tools in your account.
- ⚠️ Keep trading to keep access free — if you're inactive for 7 days, your access will be removed.
- 👉 Already have an account? You can change the IB (introducing broker) to our referral link ( https://one.exnesstrack.org/a/w7syl3vnjb ) and still qualify!
1. Pivot Points Calculation
At the core of the indicator is the calculation of pivot points. These points represent local price extremes—either highs or lows—that serve as potential turning points in the market. The pivot points are calculated using either the High/Low or Close/Open values of a specified lookback period (typically 12 bars). These calculations form the foundation for identifying the levels where price might experience support or resistance.
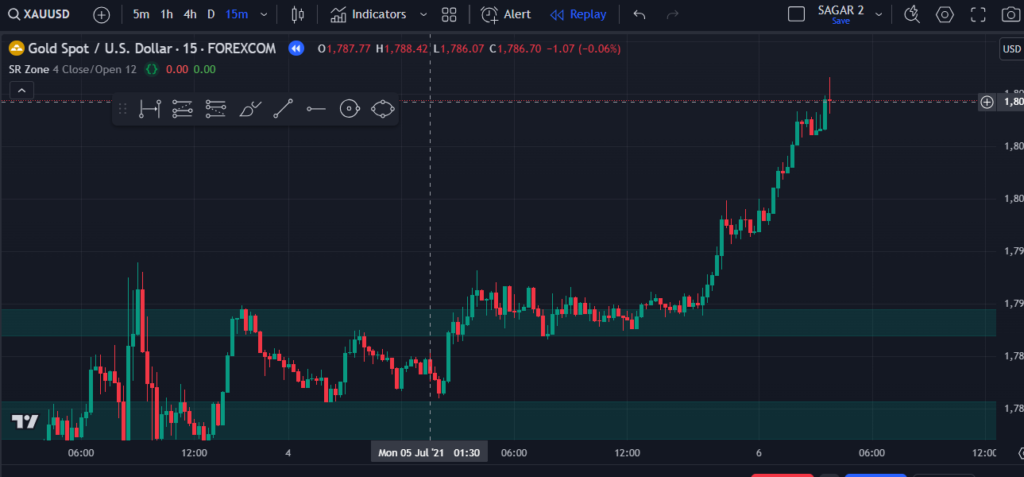
2. Support and Resistance Zones
Once the pivot points are calculated, the indicator groups these points into support and resistance zones. Support zones are created by lower pivot points where the price is expected to find buying interest, and resistance zones are formed by upper pivot points where selling pressure may be encountered. These zones are plotted on the chart as shaded or color-coded areas to make them easily identifiable.
The advantage of using zones instead of single price levels is that price rarely respects a single price point. By defining a zone, traders gain a better understanding of the potential price range within which the market could reverse or consolidate.
3. Dynamic Channel
The support and resistance zones are dynamic and update as new pivot points are identified. This allows traders to see how the levels evolve in real-time as the market moves. The zones adjust to reflect changes in market conditions, ensuring that traders always have the most relevant support and resistance levels visible on their charts.
4. Strength Evaluation
The strength of each support and resistance level is evaluated based on how often the price has interacted with it. The more frequently the price touches or bounces off a particular level, the stronger the level is considered. This helps traders gauge the reliability of these levels when making trading decisions. A level that has been tested multiple times may offer more confidence than a new or untested level.
Key Features of the Support Resistance Zone Indicator
The Support Resistance Zone indicator comes with several customizable features, allowing traders to tailor it to their specific needs:
- Pivot Source Options: Choose whether pivot points are calculated using High/Low or Close/Open values. This flexibility allows traders to adapt the indicator to different market conditions and trading strategies.
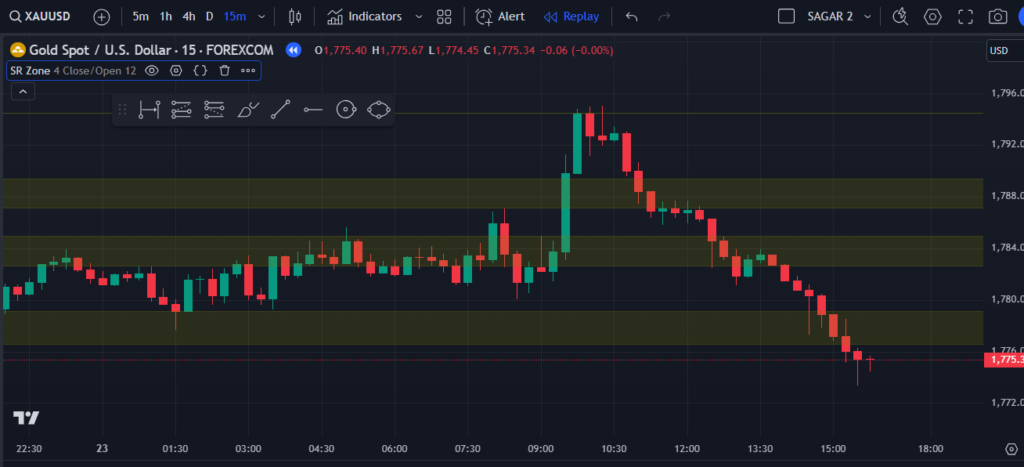
- Support and Resistance Zones: The indicator automatically detects and plots multiple support and resistance levels on the chart, helping traders to visualize key price levels without manual calculation.
- Highlight Broken Levels: A unique feature of this indicator is its ability to display signals when a support or resistance level is broken. This is particularly useful for traders looking for breakout or breakdown opportunities.
- Customizable Colors: The appearance of the support and resistance zones can be customized with different colors to match your chart’s style or to make key levels stand out more clearly.
- Max Number of Levels: The user can set a maximum number of visible support and resistance zones (up to 10), ensuring that the chart doesn’t become cluttered.
- Alert Conditions: Traders can set alerts for when support or resistance levels are breached. This is a powerful feature that helps traders react to significant market moves as they happen.
- Broken Level Markers: Visual markers appear on the chart whenever a support or resistance level is broken, making it easier to spot potential breakout opportunities.
Use Cases of the Support Resistance Zone Indicator
The Support Resistance Zone indicator is versatile and can be used in various trading scenarios. Here are some of the key use cases:
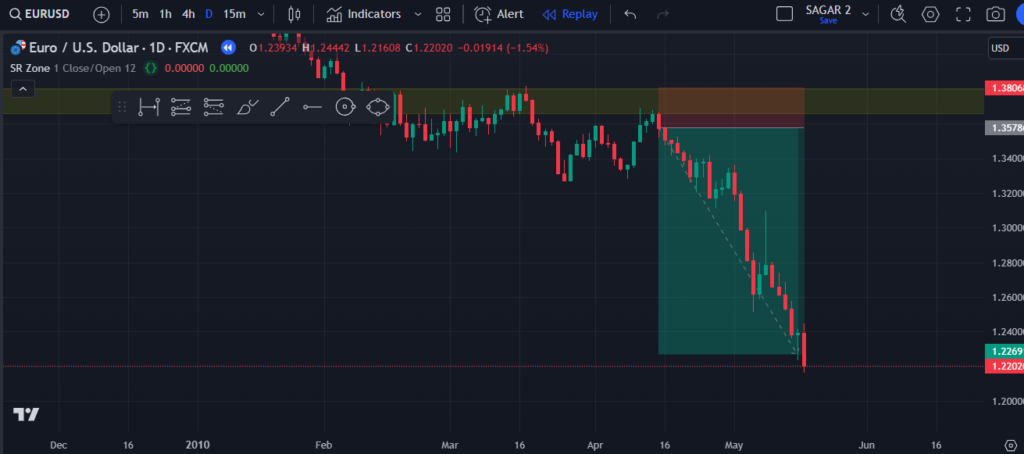
1. Trend Reversals
One of the primary ways traders use the Support Resistance Zone indicator is to identify potential trend reversal points. When price reaches a support or resistance zone, it may reverse direction, making these zones critical for spotting trend changes. For example, if price is in an uptrend and hits a resistance zone, it may signal that the market is about to reverse to the downside.
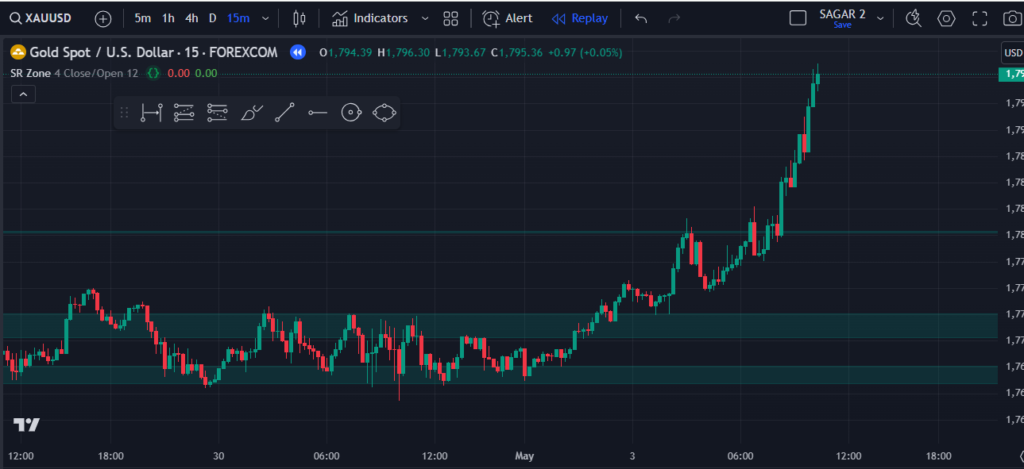
2. Breakout Trading
When the price breaks through a key support or resistance level, it can signal the start of a new trend. This is particularly important for breakout traders who look to capitalize on significant market moves. The indicator’s ability to highlight broken levels and alert traders to these events is invaluable for catching potential breakout opportunities early.
3. Market Consolidation
During periods of consolidation, the market tends to trade within a defined range, bouncing between support and resistance levels. The Support Resistance Zone indicator can help traders identify these ranges, allowing them to trade within the confines of the consolidation zone. Understanding where the market is likely to consolidate can help traders make better decisions in range-bound markets.
Conclusion
The Support Resistance Zone indicator on TradingView is an essential tool for traders who want to improve their technical analysis and decision-making. By identifying key support and resistance levels, this indicator helps traders spot potential price reversals, breakouts, and consolidation zones. With customizable features, dynamic updates, and real-time alerts, the Support Resistance Zone indicator offers valuable insights that can enhance your trading strategy. Whether you are a beginner or an experienced trader, mastering this tool on TradingView can significantly improve your market analysis and trading results.
Pinescript of Support Resistance Zone TradingView Indicator
To access this powerful indicator, reach out to us at +91 7620658346! We specialize in custom algo development for TradingView indicators, MT4/MT5 strategies, and trading bots.
Stay connected with us on Instagram, YouTube, and Twitter: @algo_aakash for the latest updates and insights!
Disclaimer
The information in this article and any associated indicators is for educational purposes only. Trading in financial markets carries substantial risk, and profits are not guaranteed. The custom Bollinger Band strategy is based on historical data and technical analysis, which may not predict future market behavior. Users should conduct their own research, assess their risk tolerance, and consult with a licensed financial advisor before making any trading decisions. The author and developer of this indicator are not liable for any losses incurred through the use of this strategy. Please trade responsibly.

0 Comments