🔓 Get All Tools for FREE!
- ✅ Click here to open a trading account using our referral link and start trading.
- 📅 After 7 days of active trading under our referral link, you can get access to all tools in your account.
- ⚠️ Keep trading to keep access free — if you're inactive for 7 days, your access will be removed.
- 👉 Already have an account? You can change the IB (introducing broker) to our referral link ( https://one.exnesstrack.org/a/w7syl3vnjb ) and still qualify!
What is the Supply and Demand Zone Indicator?
In trading, an indicator is a tool used to analyze market trends, price movements, and other essential metrics to assist traders in making informed decisions. Indicators come in various forms, such as technical, volume-based, or sentiment-based, and they are implemented on trading platforms like TradingView using scripting languages like PineScript.
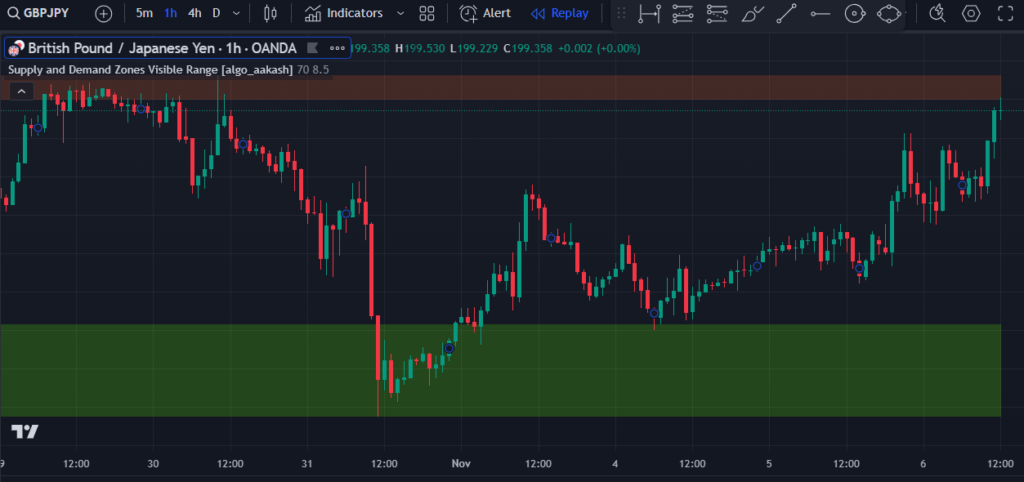
The “Supply and Demand Zones Visible Range [algo_aakash]” indicator is a prime example of a custom indicator designed to dynamically identify critical support and resistance levels. This indicator focuses on analyzing visible chart data to highlight supply and demand zones that can help traders pinpoint areas of potential price reversals or consolidations.
🔓 Get All Tools for FREE!
- ✅ Click here to open a trading account using our referral link and start trading.
- 📅 After 7 days of active trading under our referral link, you can get access to all tools in your account.
- ⚠️ Keep trading to keep access free — if you're inactive for 7 days, your access will be removed.
- 👉 Already have an account? You can change the IB (introducing broker) to our referral link ( https://one.exnesstrack.org/a/w7syl3vnjb ) and still qualify!
How Does Supply and Demand Zone Indicator Work on Tradingview
TradingView is a powerful charting and analysis platform widely used by traders and investors. The platform enables users to use pre-built indicators or develop their custom tools using Pine Script, TradingView’s proprietary scripting language. Here’s how the “Supply and Demand Zones Visible Range [algo_aakash]” indicator operates within TradingView:
Explanation of the Indicator
The “Supply and Demand Zones Visible Range [algo_aakash]” indicator leverages visible chart data to identify key price levels:
- Supply Zones (Resistance):
These zones are areas where selling pressure outweighs buying demand, often resulting in price rejection or reversals. - Demand Zones (Support):
Demand zones represent areas where buying pressure surpasses selling pressure, leading to price rallies.
The indicator calculates these zones dynamically based on the portion of the chart visible to the trader, ensuring relevance to the current market context.
Key Features of the Indicator
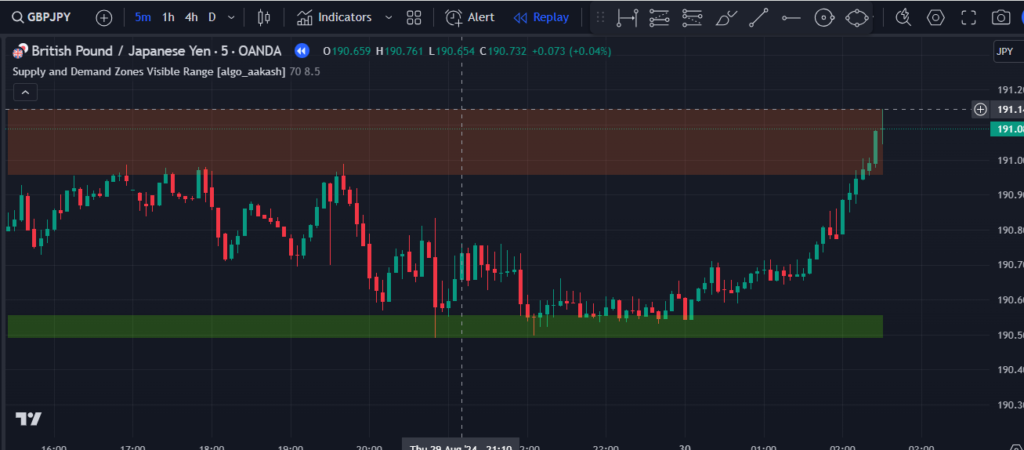
1. Visible Range Analysis
The indicator calculates supply and demand zones only for the visible portion of the chart, ensuring traders focus on relevant data. This feature allows users to zoom in or out and adjust the analysis dynamically based on their view.
2. Customizable Settings
- Timeframe:
Users can select a lower timeframe to analyze price action with greater precision. - Division and Threshold:
These settings allow users to define the resolution and significance of zones. The division determines how granular the zones are, while the threshold filters out insignificant areas, highlighting only meaningful supply and demand levels.
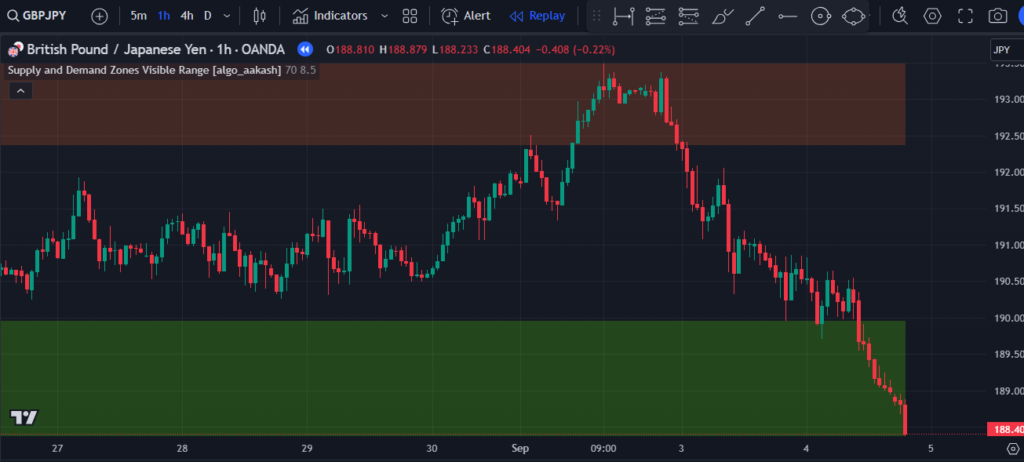
3. Zone Highlighting
- Supply Zone:
Highlighted in a distinct color, these zones mark areas with higher trading volume near price peaks, indicating resistance levels. - Demand Zone:
Highlighted differently, these zones correspond to higher volume near price lows, signaling support. - Customization Options:
Traders can adjust the colors, transparency, and visibility of the zones to match their trading style and chart layout.
How It’s Useful in Trading
1. Key Level Identification
The indicator is invaluable for identifying significant levels where price reversals, consolidations, or breakouts are likely to occur. By combining volume and price action, the tool gives traders a clear picture of market dynamics.
2. Enhanced Decision-Making
- Supply and demand zones help traders make confident decisions on when to enter or exit trades.
- These zones also act as stop-loss or take-profit markers, enhancing risk management strategies.
3. Applicable for Various Trading Styles
- Scalping:
Intraday traders can use this indicator to identify short-term supply and demand imbalances for quick trades. - Swing Trading:
Swing traders benefit from identifying robust reversal zones to hold positions for days or weeks.
By visualizing these zones on TradingView charts, traders gain a significant edge in understanding price behavior and predicting market movements.
Why Choose TradingView and PineScript for Custom Indicators?
1. TradingView’s Versatility
TradingView offers a user-friendly interface and a vast library of built-in indicators. Moreover, its customization capabilities make it the go-to platform for traders seeking advanced tools tailored to their strategies.
2. Power of PineScript
Pine Script is a scripting language specifically designed for TradingView. It enables traders to create or modify indicators like “Supply and Demand Zones Visible Range [algo_aakash]” effortlessly. Some key benefits of Pine Script include:
- Easy-to-learn syntax, perfect for beginner coders.
- Flexibility to create complex logic for advanced technical analysis.
- Quick backtesting and real-time application of strategies.
3. Community and Collaboration
TradingView hosts a vibrant community of traders who share and discuss scripts, strategies, and insights. Indicators like “Supply and Demand Zones Visible Range [algo_aakash]” are products of this collaborative ecosystem, making tools accessible to a global audience.
Conclusion
The “Supply and Demand Zones Visible Range [algo_aakash]” indicator exemplifies the practical application of technical analysis in modern trading. Built on the robust framework of TradingView and powered by Pine Script, it allows traders to identify key supply and demand levels based on visible chart data, improving accuracy in decision-making.
Whether you’re a scalper, swing trader, or long-term investor, leveraging indicators like this can enhance your strategy and provide actionable insights into market dynamics. TradingView’s advanced tools and Pine Script’s flexibility make it easier than ever to adapt such innovative indicators to your trading approach.
Pinescript of Supply and Demand Zone Tradingview Indicator
Contact us at +91 7620658346 to access this indicator. We offer algorithm development services for TradingView indicators, MT4/MT5, and trading bots. Stay connected with us on Instagram, YouTube, and Twitter: @algo_aakash.
Disclaimer
The information in this article and any related indicators is for educational purposes only. Trading in financial markets involves significant risk, and there is no guarantee of profits. The custom Bollinger Band strategy is based on historical data and technical analysis, which may not accurately forecast future market trends. Users should perform their own research, assess their risk tolerance, and seek guidance from a licensed financial advisor before making any trading decisions. The author and developer of this indicator are not responsible for any losses incurred from using this strategy. Please trade responsibly.
Click here to interact with the feature.
🔓 Get This Tool for FREE!
- ✅ Click here to open a trading account using our referral link and start trading.
- 💡 Use coupon code: FREE during checkout.
- 📅 After 7 days of active trading under our referral link, you’ll get access to this tool in your account.
- ⚠️ Keep trading to keep access free — if you're inactive for 7 days, your access will be removed.
- 👉 Already have an account? You can change the IB (introducing broker) to our referral link and still qualify!

0 Comments