🔓 Get All Tools for FREE!
- ✅ Click here to open a trading account using our referral link and start trading.
- 📅 After 7 days of active trading under our referral link, you can get access to all tools in your account.
- ⚠️ Keep trading to keep access free — if you're inactive for 7 days, your access will be removed.
- 👉 Already have an account? You can change the IB (introducing broker) to our referral link ( https://one.exnesstrack.org/a/w7syl3vnjb ) and still qualify!
The Price Action Bars indicator is a powerful tool designed to help traders identify key candlestick patterns that provide valuable insights for making trading decisions. Whether you’re new to trading or an experienced market participant, understanding price action and its related signals is crucial for effective market analysis. The Price Action Bars indicator, developed using Pine Script on TradingView, highlights specific candlestick patterns that can signal potential reversals, consolidations, or breakouts. This article explores how this indicator works, its features, and why it’s a valuable tool for traders.
What is the Price Action Bars Indicator?
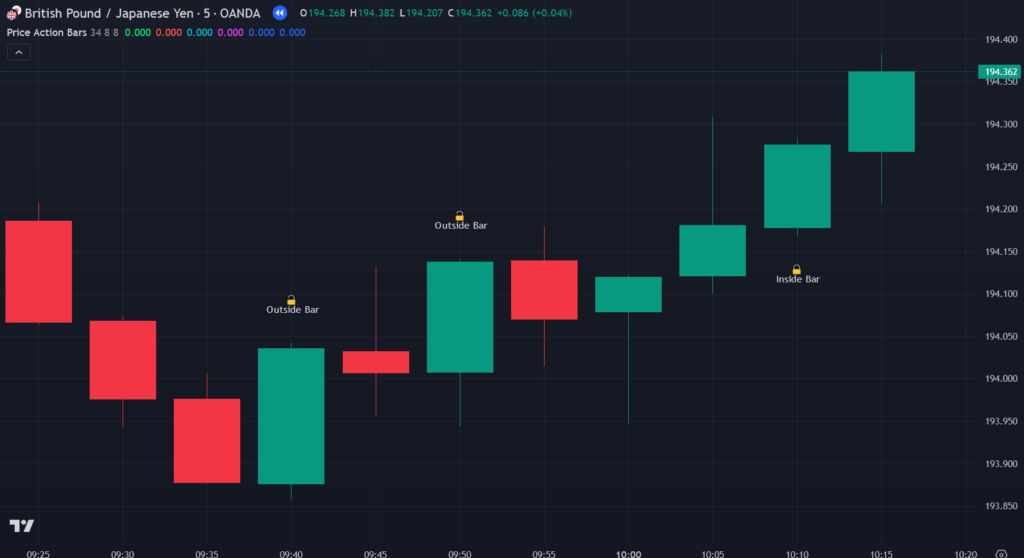
The Price Action Bars indicator focuses on recognizing key candlestick patterns that can offer significant clues about market behavior. These patterns are essential for traders who rely on price movement (rather than lagging indicators) to make decisions. The indicator automatically detects and marks the following candlestick patterns:
🔓 Get All Tools for FREE!
- ✅ Click here to open a trading account using our referral link and start trading.
- 📅 After 7 days of active trading under our referral link, you can get access to all tools in your account.
- ⚠️ Keep trading to keep access free — if you're inactive for 7 days, your access will be removed.
- 👉 Already have an account? You can change the IB (introducing broker) to our referral link ( https://one.exnesstrack.org/a/w7syl3vnjb ) and still qualify!
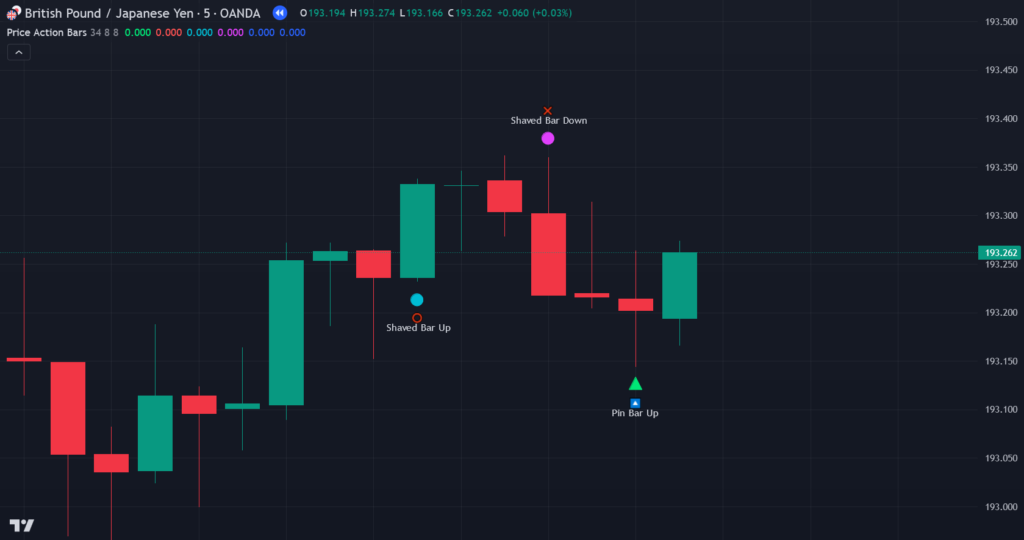
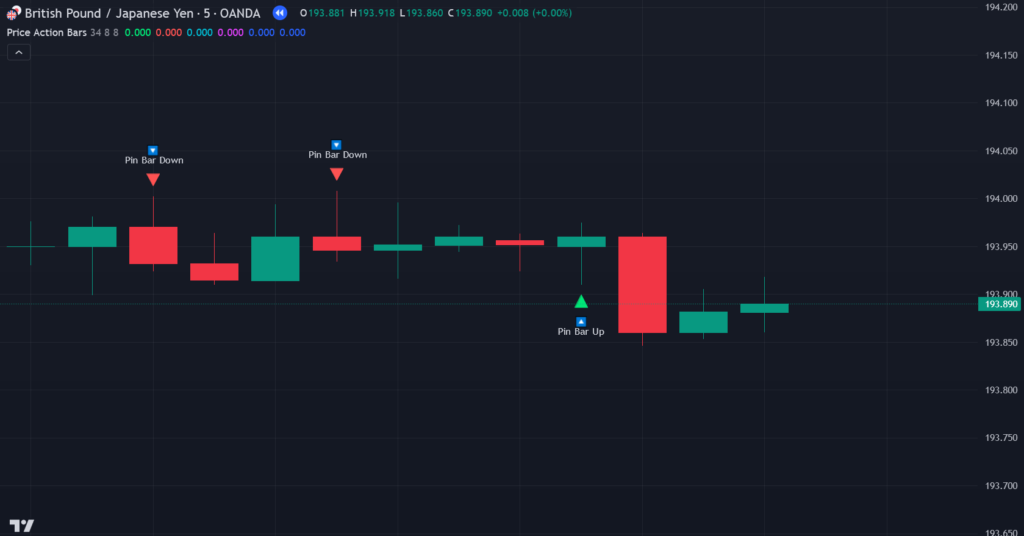
- Pin Bars (both up and down): These are reversal patterns that occur when the market rejects a certain price level, often signaling a change in the direction of the trend.
- Shaved Bars (up and down): These bars show rejection of price at the extremes, indicating a potential reversal or pause in the market.
- Inside Bars: Inside bars occur when the range of the current bar is entirely within the range of the previous bar. This pattern often signals consolidation, with the potential for a breakout in either direction.
- Outside Bars: An outside bar forms when the current bar’s range extends beyond the high and low of the previous bar. This pattern signifies strong price movement and often precedes a continuation or breakout.
How Does the Price Action Bars Indicator Work on TradingView?
The Price Action Bars indicator works by analyzing past price data and identifying these critical candlestick patterns. The indicator is powered by Pine Script, the native scripting language of TradingView, which allows for seamless integration and real-time updates on the TradingView platform.
When applied to a chart, the indicator automatically detects these patterns and highlights them with visual signals, making it easy for traders to identify potential trading opportunities. Here’s a breakdown of how it works:
- Pin Bars: The indicator identifies up and down Pin Bars, where the price has sharply moved away from a certain level, indicating a potential reversal in trend. Pin Bars are often seen at key support or resistance levels.
- Shaved Bars: These bars are similar to Pin Bars but focus on rejection of price at the extremes. Traders often use Shaved Bars to confirm potential reversal zones or areas of market indecision.
- Inside Bars: The Inside Bar pattern occurs when the current bar’s high and low are within the range of the previous bar, signaling a consolidation phase. This can be a precursor to a breakout in either direction.
- Outside Bars: When the current bar extends beyond the range of the previous bar, it indicates strong market movement. The Outside Bar is often seen before a continuation or strong trend.
Key Features of the Price Action Bars Indicator
The Price Action Bars indicator comes with several features that allow traders to customize their experience and adapt the tool to their trading strategies. Here are some of the standout features:
- Customizable Pin Bar and Shaved Bar Thresholds:
- Traders can adjust the percentage thresholds for Pin Bars and Shaved Bars, tailoring the sensitivity of the indicator to their trading style. By fine-tuning these settings, you can capture more or fewer signals, depending on your preference for risk and market conditions.
- Lookback Period for Pin Bars:
- The lookback period allows traders to define the number of bars the indicator should analyze to detect Pin Bars. This feature enables traders to fine-tune the indicator to detect Pin Bars over a longer or shorter timeframe, depending on their trading strategy.
- Visibility Controls:
- The Price Action Bars indicator gives users the option to show or hide each type of pattern: Inside Bars, Outside Bars, Pin Bars, and Shaved Bars. This feature is especially useful for traders who want to focus on specific patterns or reduce chart clutter.
- Visual Signals with Emojis:
- One of the most useful features of the Price Action Bars indicator is the visual signals it provides. The indicator uses emojis and symbols to mark each candlestick pattern on the chart, making it easy for traders to spot signals without having to manually interpret the price action. This visual aid is a valuable tool for quick decision-making, especially in fast-moving markets.
How the Price Action Bars Indicator Can Improve Your Trading
Understanding and interpreting candlestick patterns is essential for traders who rely on price action to make informed decisions. The Price Action Bars indicator simplifies this process by automatically highlighting the key patterns on the chart. Here’s how it can help traders:
- Spotting Potential Reversals:
- Pin Bars and Shaved Bars are often used to identify potential trend reversals. By spotting these patterns early, traders can enter trades with a higher probability of success, as they signify rejection of price at certain levels.
- Identifying Consolidation Phases:
- Inside Bars are an excellent tool for recognizing consolidation periods. These patterns indicate that the market is in a phase of indecision, which often precedes a breakout. By identifying Inside Bars, traders can prepare for a potential move in either direction once the market breaks the range of the inside bar.
- Visual Clarity for Faster Decision-Making:
- The visual signals provided by the indicator (using emojis and clear markers) make it easier for traders to identify key patterns without being overwhelmed by too much information. This is particularly helpful for traders who want to improve the speed and accuracy of their decision-making process.
- Trend Analysis and Market Timing:
- By highlighting important candlestick patterns in real time, the Price Action Bars indicator helps traders identify trends early and understand the market’s momentum. This allows traders to make better decisions regarding entry, stop-loss, and take-profit levels.
Conclusion: Why Use the Price Action Bars Indicator on TradingView?
The Price Action Bars indicator is an invaluable tool for traders looking to gain a deeper understanding of market price action. By identifying key candlestick patterns like Pin Bars, Shaved Bars, Inside Bars, and Outside Bars, the indicator helps traders make informed decisions based on price movement rather than relying solely on lagging indicators. Its customizable features, such as adjustable thresholds and lookback periods, allow traders to tailor the tool to their specific needs and trading style. With its visual clarity and easy-to-interpret signals, the Price Action Bars indicator is a must-have tool for traders using TradingView and Pine Script to enhance their trading strategies.
By adding the Price Action Bars indicator to your TradingView chart, you can gain a clearer understanding of market behavior, identify potential reversal and breakout signals, and improve your overall trading strategy.
Pinescript of Price Action Bars Indicator on TradingView
For access to this indicator, reach out to us at +91 7620658346. We offer custom algorithm development for TradingView, MT4/MT5, and trading bots.
Stay updated by following us on Instagram, YouTube, and Twitter @algo_aakash.
Disclaimer
The information in this article and any related indicators is for educational purposes only. Trading in financial markets involves substantial risk, and profits are not guaranteed. The custom Bollinger Band strategy is based on historical data and technical analysis, which may not accurately forecast future market behavior. Users should perform their own research, assess their risk tolerance, and consult with a licensed financial advisor before making any trading decisions. The author and developer of this indicator are not responsible for any losses resulting from the use of this strategy. Please trade responsibly.

0 Comments