🔓 Get All Tools for FREE!
- ✅ Click here to open a trading account using our referral link and start trading.
- 📅 After 7 days of active trading under our referral link, you can get access to all tools in your account.
- ⚠️ Keep trading to keep access free — if you're inactive for 7 days, your access will be removed.
- 👉 Already have an account? You can change the IB (introducing broker) to our referral link ( https://one.exnesstrack.org/a/w7syl3vnjb ) and still qualify!
In the fast-paced world of financial markets, having a reliable strategy to identify entry and exit points is essential for traders. One of the most effective and widely used methods for spotting potential trading opportunities is through the use of moving averages, particularly the Exponential Moving Average (EMA). The Powerful EMA Crossover Indicator leverages this concept to help traders spot trend reversals, market momentum, and potential buying and selling signals with ease.
This custom EMA crossover tool uses the interaction between a 20-period EMA and a 50-period EMA to generate actionable buy and sell signals. The 20-period EMA reacts quickly to price changes, while the 50-period EMA provides a broader perspective of the market’s long-term trend. In this post, we’ll dive into how this indicator works, its key benefits, and why it’s a valuable addition to any trader’s toolkit.
What is the EMA Crossover Indicator?
The Powerful EMA Crossover Indicator is designed to visually highlight the crossover between two specific EMAs on the price chart. This crossover method provides traders with clear, rule-based signals to enter or exit trades, simplifying decision-making in fast-moving markets. The two EMAs used are the 20-period EMA (often referred to as the short-term EMA) and the 50-period EMA (the long-term EMA).
🔓 Get All Tools for FREE!
- ✅ Click here to open a trading account using our referral link and start trading.
- 📅 After 7 days of active trading under our referral link, you can get access to all tools in your account.
- ⚠️ Keep trading to keep access free — if you're inactive for 7 days, your access will be removed.
- 👉 Already have an account? You can change the IB (introducing broker) to our referral link ( https://one.exnesstrack.org/a/w7syl3vnjb ) and still qualify!
By plotting both the short-term and long-term EMAs on the chart, the indicator offers a dynamic view of price movements. When the short-term EMA crosses above the long-term EMA, it’s a sign that momentum is shifting upward, potentially signaling a buying opportunity. Conversely, when the short-term EMA crosses below the long-term EMA, it’s a sign of weakening momentum, indicating a potential sell signal.
Powerful EMA Crossover Indicator: How to Use 20-50 EMA Crossovers for Smarter Trading Decisions
How It Works: The Mechanics of the EMA Crossover
The Powerful EMA Crossover Indicator operates on a simple yet highly effective principle: the intersection of two EMAs. Here’s how it functions in detail:
1. Buy Signal:
- A buy signal occurs when the faster-moving 20-period EMA crosses above the slower-moving 50-period EMA. This crossover suggests that recent price movements have been strong enough to shift the market’s short-term momentum upward.
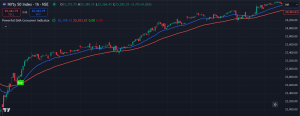
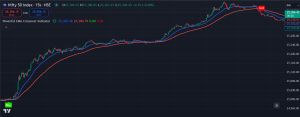
- When this crossover happens, the indicator will plot a green “Buy” label on the chart to visually indicate this bullish momentum shift. Traders can use this signal as a potential entry point for long positions.
2. Sell Signal:
- A sell signal is triggered when the 20-period EMA crosses below the 50-period EMA. This movement suggests that the market’s recent price activity is weakening, signaling a potential downtrend.
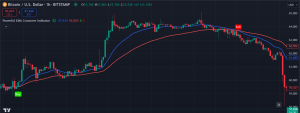
- When this bearish crossover occurs, the indicator plots a red “Sell” label, helping traders easily identify potential exit points for long positions or entry points for short positions.
3. Visual Cues for Better Decision-Making:
- The indicator includes easy-to-spot buy and sell labels directly on the price chart. Green “Buy” labels highlight potential upward momentum, while red “Sell” labels indicate potential downward momentum. This makes decision-making faster and more intuitive, even for traders who may not have years of experience.
Key Benefits of the Powerful EMA Crossover Indicator
The Powerful EMA Crossover Indicator offers several advantages that make it a popular choice among traders, whether you’re a beginner or a seasoned professional:
1. Simplicity and Clarity:
- The EMA crossover strategy is simple to understand and implement. It eliminates much of the guesswork associated with determining market trends and potential entry/exit points.
- The visual labels make it easy to spot trading opportunities at a glance, reducing the complexity of technical analysis.
2. Effective for Trend Identification:
- EMAs are effective in identifying trends because they smooth out price fluctuations. The crossover between a short-term and long-term EMA helps traders confirm whether they’re in a trending market and in which direction.
- The 20-period EMA provides a more sensitive response to price changes, while the 50-period EMA offers a broader view of the market’s general direction.
3. Adaptability Across Markets and Timeframes:
- This indicator is versatile and can be used across multiple financial markets, including stocks, forex, cryptocurrencies, and commodities.
- Whether you’re a day trader, swing trader, or long-term investor, this crossover strategy can be adapted to different timeframes, providing signals that are relevant to your specific trading style.
4. Improved Risk Management:
- By identifying potential turning points in the market, the EMA crossover strategy can help traders manage risk more effectively. Traders can set tighter stop-loss levels and adjust their risk exposure based on the strength of the trend identified by the EMA crossover.
- Knowing when to enter and exit trades with more confidence allows for better control over potential losses and profits.
5. Backtesting and Optimization:
- Because the rules for this strategy are straightforward, traders can easily backtest the EMA crossover system to see how it performs in different market conditions. This ability to backtest offers valuable insights and allows traders to optimize the strategy for better results.
EMA Crossover in Action: Practical Example
Let’s take a look at how the Powerful EMA Crossover Indicator might perform in real-world market conditions:
Example:
Imagine you’re trading a stock that has been experiencing sideways movement, and you’re waiting for a signal that indicates a potential breakout. The 20-period EMA is slowly approaching the 50-period EMA.
- As soon as the 20-period EMA crosses above the 50-period EMA, the indicator plots a green “Buy” label on the chart. This signal tells you that short-term momentum is gaining strength, and you might consider entering a long position.
- Later, as the price rallies and reaches its peak, the 20-period EMA begins to dip and eventually crosses below the 50-period EMA. The indicator now plots a red “Sell” label, suggesting that the market momentum is weakening. This is your cue to exit your long position or even consider a short position as the downtrend begins.
Powerful EMA Crossover Indicator: How to Use 20-50 EMA Crossovers for Smarter Trading Decisions
//@version=5
// insta id @algo_aakash
indicator(“Powerful EMA Crossover Indicator”, overlay=true)
// Calculate the 20-period and 50-period EMAs
ema20 = ta.ema(close, 20)
ema50 = ta.ema(close, 50)
// Plot the EMAs with different colors
plot(ema20, color=color.blue, linewidth=2, title=”EMA 20″)
plot(ema50, color=color.red, linewidth=2, title=”EMA 50″)
// Buy signal: EMA 20 crosses above EMA 50
buySignal = ta.crossover(ema20, ema50)
// Sell signal: EMA 20 crosses below EMA 50
sellSignal = ta.crossunder(ema20, ema50)
plotshape(buySignal, style=shape.labelup, location=location.belowbar, color=#1be100, size=size.tiny, title=’Buy’, text=’Buy’, textcolor=color.white)
plotshape( sellSignal, style=shape.labeldown, location=location.abovebar, color=#fc0000, size=size.tiny, title=’Sell’, text=’Sell’, textcolor=color.white)
Powerful EMA Crossover Indicator: How to Use 20-50 EMA Crossovers for Smarter Trading Decisions
Conclusion:
Why the EMA Crossover Indicator is Essential for Traders
The Powerful EMA Crossover Indicator is a simple yet highly effective tool that empowers traders to make informed decisions. By using the crossover of two EMAs—one short-term and one long-term—this indicator provides clear and actionable buy and sell signals, helping traders navigate market trends with more precision.
Whether you’re a beginner or an experienced trader, this indicator can enhance your trading strategy by offering clarity, simplicity, and adaptability across different markets and timeframes. For anyone looking to better understand market trends and manage trades more effectively, the Powerful EMA Crossover Indicator is a must-have addition to your trading arsenal.
0 Comments