🔓 Get All Tools for FREE!
- ✅ Click here to open a trading account using our referral link and start trading.
- 📅 After 7 days of active trading under our referral link, you can get access to all tools in your account.
- ⚠️ Keep trading to keep access free — if you're inactive for 7 days, your access will be removed.
- 👉 Already have an account? You can change the IB (introducing broker) to our referral link ( https://one.exnesstrack.org/a/w7syl3vnjb ) and still qualify!
The PMax on RSI with T3 Enhanced indicator is a powerful tool designed for traders looking to enhance their market analysis and improve trade accuracy. By combining the Relative Strength Index (RSI), Tillson T3 moving average, and ATR (Average True Range), this indicator helps traders identify potential support and resistance levels, as well as dynamic entry and exit points. Let’s dive deeper into how this indicator works and how it can help you take your trading to the next level on TradingView.
What is the PMax on RSI with T3 Enhanced Indicator?
The PMax on RSI with T3 Enhanced indicator is a custom-built tool on TradingView that integrates advanced calculations to provide smoother, more reliable signals. The indicator is built using Pine Script, TradingView’s scripting language, enabling it to provide dynamic support and resistance levels that adapt to market conditions.
🔓 Get All Tools for FREE!
- ✅ Click here to open a trading account using our referral link and start trading.
- 📅 After 7 days of active trading under our referral link, you can get access to all tools in your account.
- ⚠️ Keep trading to keep access free — if you're inactive for 7 days, your access will be removed.
- 👉 Already have an account? You can change the IB (introducing broker) to our referral link ( https://one.exnesstrack.org/a/w7syl3vnjb ) and still qualify!
The core components of this indicator are:
- RSI (Relative Strength Index): The RSI is a momentum oscillator that measures the speed and change of price movements. It helps traders understand whether an asset is overbought or oversold, and it is traditionally used to spot potential trend reversals.
- Tillson T3 Moving Average: The T3 moving average is an advanced smoothing technique that reduces lag, making it more responsive to price movements compared to traditional moving averages. This helps generate more accurate trend-following signals.
- ATR (Average True Range): ATR measures market volatility and is used to determine dynamic support and resistance levels. By incorporating ATR, this indicator adapts to different market conditions, ensuring the levels remain relevant as volatility fluctuates.
Key Features of the PMax on RSI with T3 Enhanced Indicator
- RSI with Enhanced Calculation
Unlike the standard RSI, the PMax on RSI with T3 Enhanced indicator uses a weighted moving average (WWMA) for calculating the RSI. This modification smooths the RSI line, providing clearer, more responsive signals that help traders spot potential buy or sell opportunities in real-time. The smoothed RSI reduces noise and helps you focus on the bigger trends. - Tillson T3 Moving Average
One of the key features of this indicator is the application of the Tillson T3 moving average to the RSI. This is a more advanced form of smoothing compared to traditional moving averages, as it helps reduce lag and offers a more precise reflection of price trends. The T3 moving average provides a robust trend-following line that adapts to price changes quickly, enhancing the indicator’s overall performance. - PMax Calculation for Dynamic Support and Resistance Levels
The PMax levels are calculated using the combination of the smoothed moving average (MAvg) and the ATR. These levels act as dynamic support and resistance zones, shifting according to the market’s volatility. By identifying these levels, traders can spot potential buy or sell zones with greater accuracy. The PMax levels help traders understand where price may face significant support or resistance, providing better insight into market movements. - Custom Alerts for Timely Trade Signals
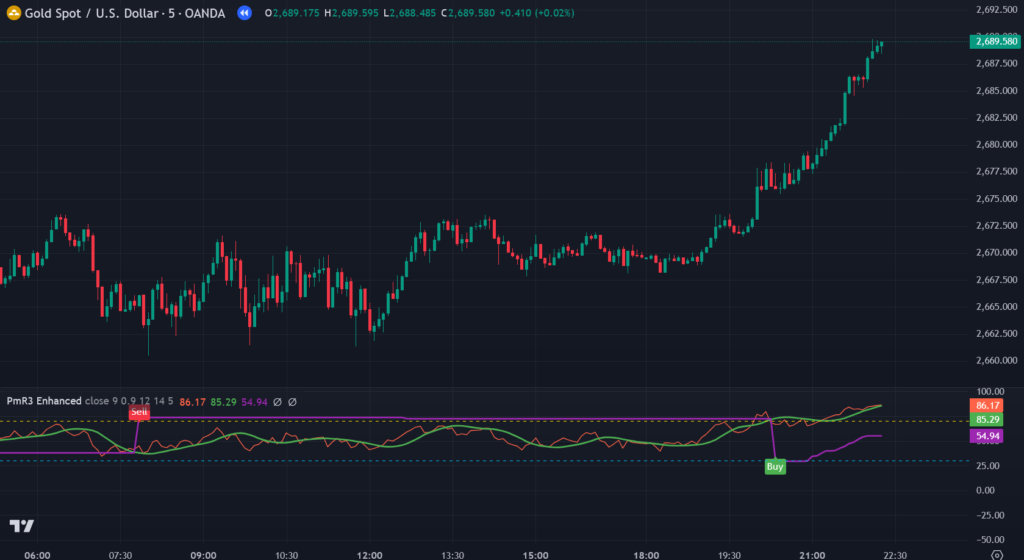
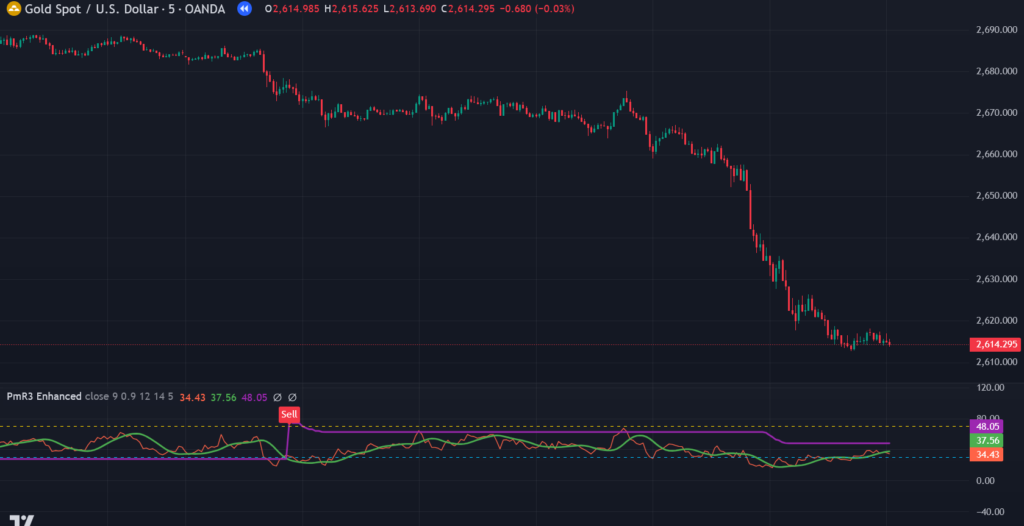
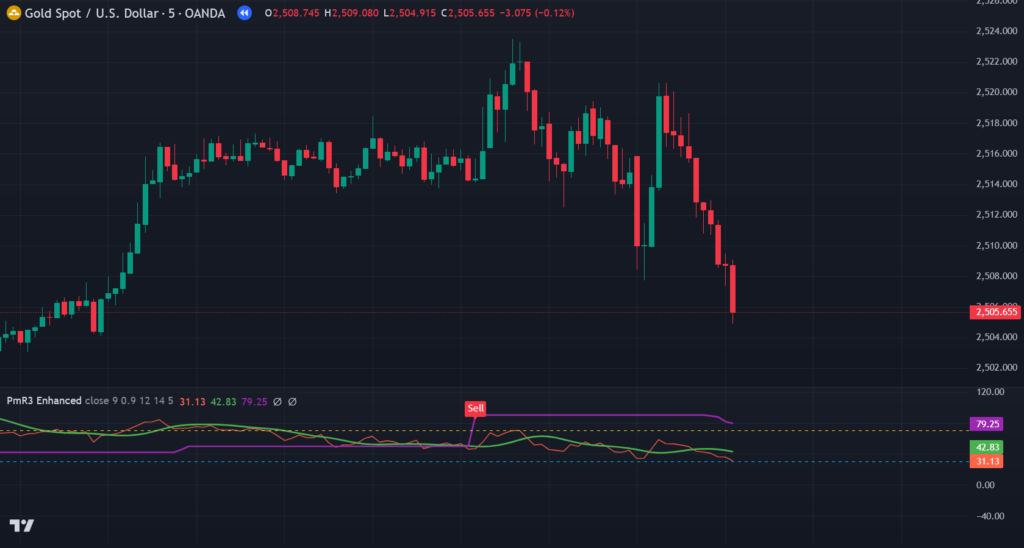
A powerful feature of this indicator is the alert system. Alerts are triggered when the price crosses above or below the PMax level, or when the moving average crosses the PMax level. These alerts can be customized to match individual trading preferences, allowing traders to receive notifications in real-time when significant price action occurs. This helps traders stay on top of market movements without constantly monitoring charts. - Visual Buy/Sell Signals
To make trading decisions even easier, the PMax on RSI with T3 Enhanced indicator plots clear buy and sell signals on the chart. These signals appear when specific crossover conditions are met, such as when the price crosses the PMax level or when the RSI crosses above or below the moving average. These markers act as visual cues to help traders enter or exit trades, reducing the need for manual analysis. - Adjustable Offsets
The indicator allows traders to adjust the offset values for the buy and sell signals, providing flexibility to suit different market conditions and trading strategies. This customization feature helps traders fine-tune their approach, optimizing the performance of the indicator for their unique trading style.
How the PMax on RSI with T3 Enhanced Works on TradingView
TradingView is a powerful charting platform that offers a wide range of tools for traders. The PMax on RSI with T3 Enhanced indicator leverages the power of Pine Script, TradingView’s proprietary scripting language, to deliver real-time signals and dynamic support and resistance levels. Here’s a step-by-step guide on how this indicator works on TradingView:
- Setting Up the Indicator:
First, add the indicator to your TradingView chart by searching for it in the Public Library or pasting the Pine Script code into the TradingView Pine Script editor. Once added, the indicator will automatically plot the RSI with T3 smoothing, PMax support and resistance levels, and buy/sell signals on your chart. - Using the Indicator to Spot Trends and Reversals:
The smoothed RSI helps you identify the current market conditions. When the RSI is above 70, it indicates that the asset is overbought, while readings below 30 suggest it is oversold. With the PMax levels, you can see where price may reverse or continue its trend, giving you a clear indication of potential entry or exit points. - Setting Alerts for Notifications:
You can set custom alerts for when the price crosses the PMax level or when the moving average crosses the PMax level. These alerts help you stay informed of key price movements and trends, allowing you to take timely action. - Placing Trades with Confidence:
The buy and sell signals generated by the indicator serve as confirmation of potential trade setups. For example, when the RSI crosses above the moving average and the price breaks through the PMax resistance level, a buy signal is triggered. Similarly, a sell signal occurs when the price breaks below the PMax support level.
Benefits of Using the PMax on RSI with T3 Enhanced Indicator
- Improved Signal Accuracy: The enhanced RSI calculation and T3 smoothing reduce noise, providing clearer and more accurate trading signals.
- Dynamic Support and Resistance Levels: The PMax levels, adjusted for market volatility using ATR, give traders a better understanding of price behavior.
- Custom Alerts: Set up real-time alerts to stay updated on potential trade opportunities without constantly watching the charts.
- Clear Buy/Sell Signals: Visual markers help traders quickly identify optimal entry and exit points, reducing the chance of missing opportunities.
Conclusion
The PMax on RSI with T3 Enhanced indicator is an invaluable tool for traders on TradingView, combining the power of advanced technical analysis with real-time dynamic support and resistance levels. By incorporating Pine Script and powerful features like enhanced RSI calculation, Tillson T3 moving average, and ATR-based PMax levels, this indicator helps traders spot trend reversals, continuations, and market entry/exit points with confidence. With customizable alerts and visual buy/sell markers, it offers a streamlined trading experience suitable for all types of traders.
Pinescript of PMax on RSI with T3 Enhanced TradingView Indicator
To access this indicator, contact us at +91 7620658346. We offer expert algorithm development for TradingView, MT4/MT5, and trading bots.
Stay connected with us on Instagram, YouTube, and Twitter @algo_aakash for the latest updates.
Disclaimer
The information provided in this article and any associated indicators is for educational purposes only. Trading financial markets involves significant risk, and profits are not guaranteed. The custom Bollinger Band strategy is based on historical data and technical analysis, which may not accurately predict future market movements. Users should conduct their own research, assess their risk tolerance, and consult with a licensed financial advisor before making any trading decisions. The author and developer of this indicator are not responsible for any losses incurred from using this strategy. Trade at your own risk.
Click here to interact with the feature.
🔓 Get This Tool for FREE!
- ✅ Click here to open a trading account using our referral link and start trading.
- 💡 Use coupon code: FREE during checkout.
- 📅 After 7 days of active trading under our referral link, you’ll get access to this tool in your account.
- ⚠️ Keep trading to keep access free — if you're inactive for 7 days, your access will be removed.
- 👉 Already have an account? You can change the IB (introducing broker) to our referral link and still qualify!

0 Comments