🔓 Get All Tools for FREE!
- ✅ Click here to open a trading account using our referral link and start trading.
- 📅 After 7 days of active trading under our referral link, you can get access to all tools in your account.
- ⚠️ Keep trading to keep access free — if you're inactive for 7 days, your access will be removed.
- 👉 Already have an account? You can change the IB (introducing broker) to our referral link ( https://one.exnesstrack.org/a/w7syl3vnjb ) and still qualify!
In the world of technical analysis, moving averages (MAs) are among the most widely used tools for identifying trends and smoothing price data. The Multiple MA Clouds Indicator on TradingView offers traders an advanced method to visualize the relationship between short-term and long-term moving averages in the form of dynamic “clouds.” By utilizing different types of moving averages and displaying them as clouds on the chart, this indicator enhances trend identification, reversal signals, and momentum analysis. In this article, we will dive deep into the functionality of this powerful Pine Script™ indicator, explain how it works, and explore its various use cases.
What is the Multiple MA Clouds Indicator?
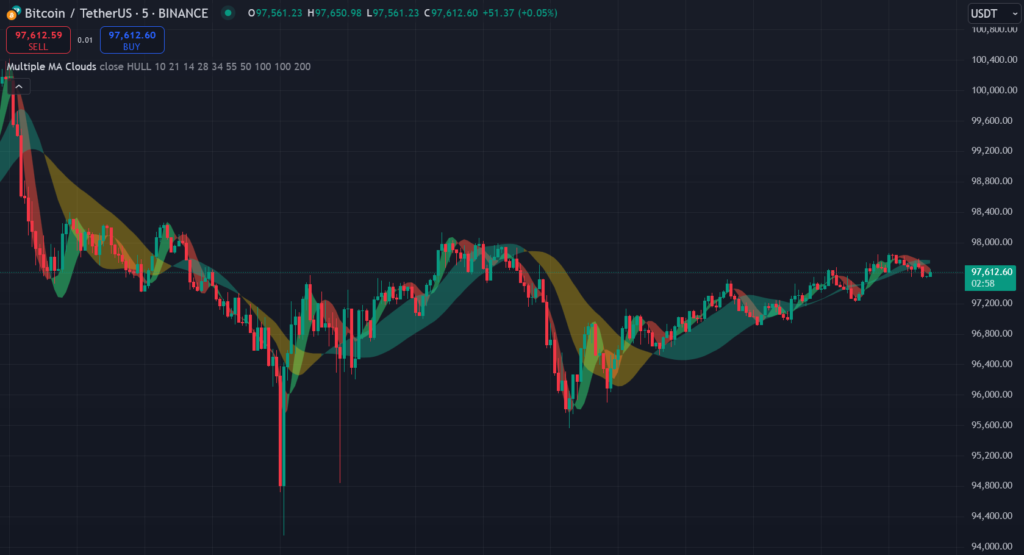
The Multiple MA Clouds indicator is a custom Pine Script™ tool designed for TradingView users. This indicator overlays multiple moving averages on the chart to visually represent the difference between short-term and long-term moving averages. These differences are shown as “clouds,” which help traders identify trends and anticipate potential market reversals. The clouds change color based on the relationship between the short-term and long-term moving averages, offering a quick and easy-to-read visualization of price action.
How Does Multiple MA Clouds Indicator Work on TradingView?
The Multiple MA Clouds Indicator is built using Pine Script™, TradingView’s proprietary scripting language. The script allows users to customize several key parameters and adjust the visualization according to their trading needs. Below are the core components that make this indicator so effective:
🔓 Get All Tools for FREE!
- ✅ Click here to open a trading account using our referral link and start trading.
- 📅 After 7 days of active trading under our referral link, you can get access to all tools in your account.
- ⚠️ Keep trading to keep access free — if you're inactive for 7 days, your access will be removed.
- 👉 Already have an account? You can change the IB (introducing broker) to our referral link ( https://one.exnesstrack.org/a/w7syl3vnjb ) and still qualify!
1. Inputs
- Source: The source input allows users to specify which price data to use for calculating the moving averages. Options include close, open, high, low, etc.
- MA Type: The indicator supports a variety of moving average types. Traders can choose from:
- SMA (Simple Moving Average)
- EMA (Exponential Moving Average)
- DEMA (Double Exponential Moving Average)
- WMA (Weighted Moving Average)
- HULL (Hull Moving Average)
- TMA (Triangular Moving Average)
- WWMA (Weighted Window Moving Average) – A custom function
- ZLEMA (Zero-Lag Exponential Moving Average) – A custom function
2. Lengths
Users can define the length of the short-term and long-term moving averages for up to five pairs. The lengths of these moving averages are crucial in determining the sensitivity of the cloud to price changes.
3. Custom Functions
- WWMA: A custom function that calculates the Weighted Window Moving Average, which applies a weighted average formula based on an alpha factor.
- ZLEMA: The Zero-Lag Exponential Moving Average reduces the lag effect typical in standard exponential moving averages by adjusting the source price.
4. MA Calculation
The script uses a function called calculate_ma() to compute the selected moving average for each defined length. It can handle all of the included moving average types and custom functions, ensuring flexibility for traders.
5. Plot and Fill Logic
The short-term and long-term moving averages are calculated for all five pairs, and the area between them is filled with a cloud. The color of the cloud is determined by the relative position of the short-term and long-term moving averages:
- Green Cloud: Indicates an uptrend when the short-term MA is above the long-term MA.
- Red Cloud: Indicates a downtrend when the short-term MA is below the long-term MA.
6. Visualization
- Short-term MAs: Plotted with a width of 1 and colored green or red depending on the trend direction.
- Long-term MAs: Plotted with a width of 3 and similarly color-coded.
- Clouds: The space between the short-term and long-term MAs is filled with a semi-transparent color, visually indicating trend strength.
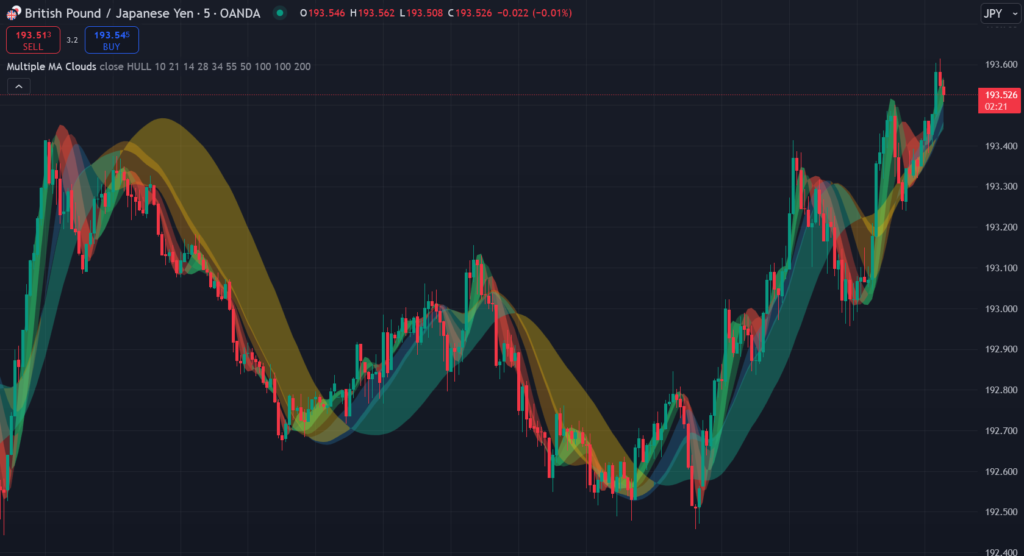
Cloud Logic and Visualization
The primary function of the clouds is to represent the difference between short-term and long-term moving averages:
- Bullish Signal: When the short-term MA is above the long-term MA, the cloud is green, signaling an uptrend.
- Bearish Signal: When the short-term MA is below the long-term MA, the cloud is red, indicating a downtrend.
The cloud width provides insight into trend strength. A wider cloud suggests a stronger trend, while a narrower cloud signals weaker momentum.
MA Clouds Explained
Each pair of short-term and long-term moving averages generates its own cloud:
- MA Cloud 1: Represents the first pair of MAs.
- MA Cloud 2: Represents the second pair.
- MA Cloud 3: Represents the third pair.
- MA Cloud 4: Represents the fourth pair.
- MA Cloud 5: Represents the fifth pair.
Traders can toggle the visibility of each cloud based on their preferences, allowing for customizable chart analysis.
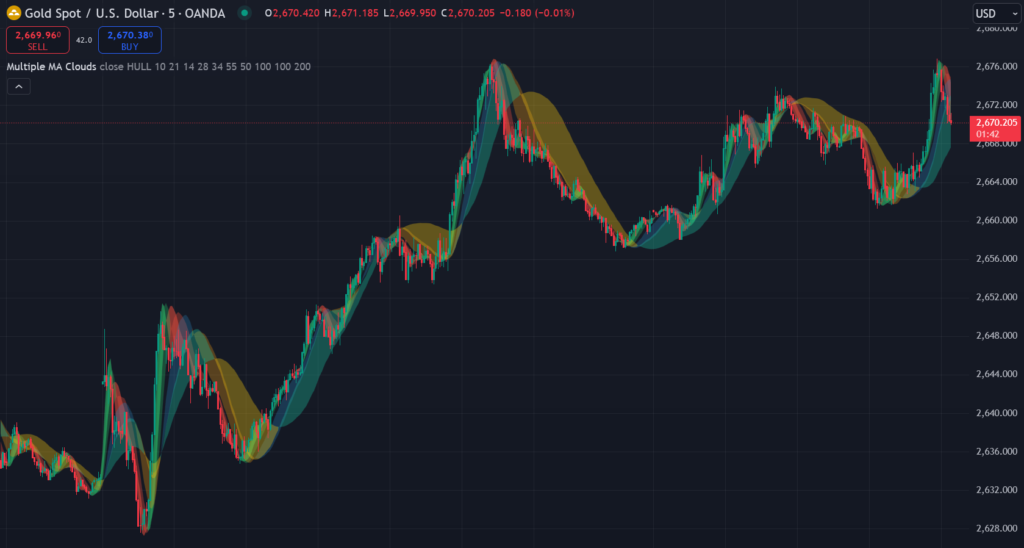
Use Cases of the Multiple MA Clouds Indicator
1. Trend Identification
The cloud colors are an excellent way to quickly determine the market’s direction. A green cloud suggests the market is in an uptrend, while a red cloud signals a downtrend. By observing the cloud’s color, traders can make decisions that align with the broader market trend.
2. Reversal Signals
The color change of the cloud, or when the short-term MA crosses the long-term MA, can signal a potential market reversal. For example, when a red cloud turns green, it may indicate that the price is starting to move upwards, signaling a buying opportunity.
3. Trend Confirmation
The width of the cloud reflects the strength of the trend. A wider cloud indicates a stronger trend, while a narrower cloud suggests that the momentum is weakening. Traders can use this information to confirm their trades and adjust their strategies accordingly.
Conclusion
The Multiple MA Clouds Indicator on TradingView is an invaluable tool for traders looking to enhance their technical analysis with dynamic visualizations. By using different types of moving averages and displaying them as clouds, this Pine Script™ indicator helps traders identify trends, spot potential reversals, and gauge the strength of market momentum. With customizable inputs, flexible settings, and clear cloud logic, this indicator is a versatile addition to any trader’s toolkit. Whether you’re a trend-following trader or someone who uses moving averages for confirmation, the Multiple MA Clouds indicator can provide valuable insights to make more informed decisions.
By leveraging the power of TradingView and Pine Script™, traders can now access a tool that not only simplifies trend analysis but also makes it visually intuitive, allowing for better, more profitable trading strategies.
Pinescript of Multiple MA Clouds TradingView Indicator
Get in touch with us at +91 7620658346 to access this indicator. We provide algorithm development services for TradingView, MT4/MT5, and trading bots.
Follow us on Instagram, YouTube, and Twitter @algo_aakash for the latest updates!
Disclaimer
The information in this article and any associated indicators is intended for educational purposes only. Trading financial markets carries a high level of risk, and there is no guarantee of profit. The custom Bollinger Band strategy is based on historical data and technical analysis, which may not accurately predict future market trends. Users should do their own research, assess their risk tolerance, and consult with a licensed financial advisor before making any trading decisions. The author and developer of this indicator are not liable for any losses incurred from using this strategy. Please trade responsibly.

0 Comments