🔓 Get All Tools for FREE!
- ✅ Click here to open a trading account using our referral link and start trading.
- 📅 After 7 days of active trading under our referral link, you can get access to all tools in your account.
- ⚠️ Keep trading to keep access free — if you're inactive for 7 days, your access will be removed.
- 👉 Already have an account? You can change the IB (introducing broker) to our referral link ( https://one.exnesstrack.org/a/w7syl3vnjb ) and still qualify!
In the world of technical analysis, traders rely on various indicators to identify potential buy and sell opportunities. One of the most powerful combinations of indicators is the MACD (Moving Average Convergence Divergence) and Bollinger Bands, enhanced further with the 200 EMA (Exponential Moving Average) filter. When used together, these indicators can provide highly reliable signals that assist traders in making informed decisions. In this article, we will explore the MACD-Bollinger Bands Indicator with a 200 EMA filter, how it works, and how you can implement it on TradingView using Pine Script for optimal trading strategies.
What Is the MACD-Bollinger Bands Indicator?
The MACD-Bollinger Bands Indicator combines two widely used technical analysis tools: the MACD and Bollinger Bands. The MACD is a momentum-based indicator that helps traders identify potential trend reversals and the strength of price movements, while the Bollinger Bands provide a measure of market volatility. Adding the 200 EMA filter to this combination helps traders focus on the long-term market trend and avoid false signals that can often occur during choppy market conditions.
🔓 Get All Tools for FREE!
- ✅ Click here to open a trading account using our referral link and start trading.
- 📅 After 7 days of active trading under our referral link, you can get access to all tools in your account.
- ⚠️ Keep trading to keep access free — if you're inactive for 7 days, your access will be removed.
- 👉 Already have an account? You can change the IB (introducing broker) to our referral link ( https://one.exnesstrack.org/a/w7syl3vnjb ) and still qualify!
Here’s a breakdown of how each component works:
- MACD: The MACD is a trend-following momentum indicator that calculates the difference between a fast-moving average (12-period) and a slow-moving average (26-period). The MACD line (difference between these averages) oscillates above and below a signal line (the 9-period moving average of the MACD line). The crossing of these lines helps identify potential buying or selling opportunities.
- Bollinger Bands: These bands are created by plotting two standard deviations away from a 20-period moving average. When the price approaches the upper or lower Bollinger Band, it can indicate overbought or oversold conditions, making it a useful tool for identifying potential reversals.
- 200 EMA: The 200 EMA is a long-term trend-following indicator that smooths out price data to identify the overall market trend. In this indicator, the 200 EMA acts as a filter, ensuring that traders only take signals that align with the long-term market trend.
How the MACD-Bollinger Bands Indicator Works On Tradingview
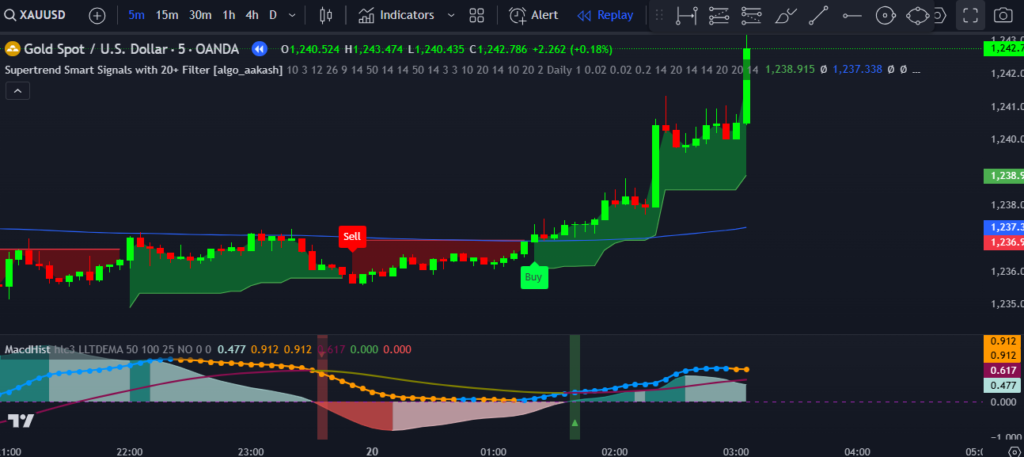
The combined use of the MACD, Bollinger Bands, and the 200 EMA helps traders spot high-quality entry and exit points. Here’s how it works in practice:
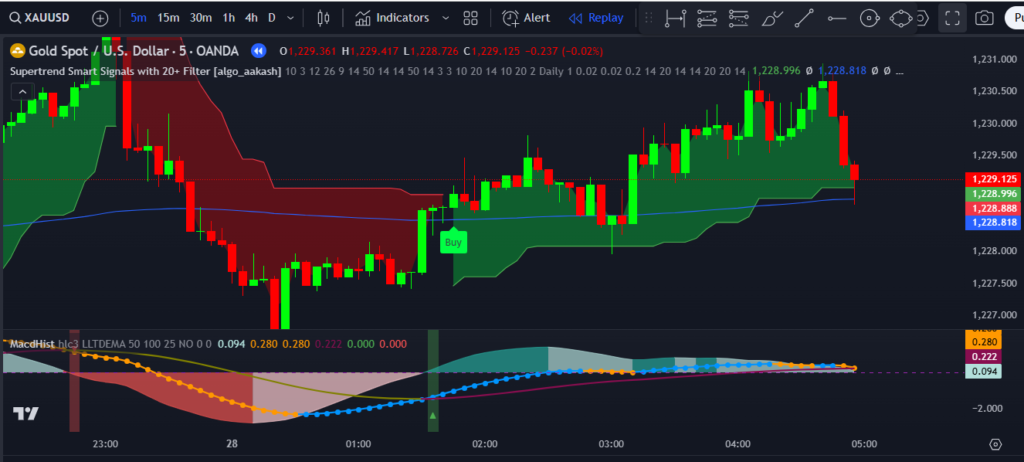
Buy Signal:
A Buy Signal occurs when the MACD line crosses above the upper Bollinger Band and the price is above the 200 EMA. This indicates that the market is showing strong bullish momentum, and the price is breaking through its volatility resistance level.
Stop Loss:
For risk management, the Stop Loss is placed at the most recent swing low. This ensures that if the market reverses and moves against your position, your losses are minimized.
Take Profit:
The Take Profit is set at a 1:2 risk-reward ratio. This means that for every unit of risk taken (i.e., the distance between your entry and stop loss), you aim for a profit that is twice that amount.
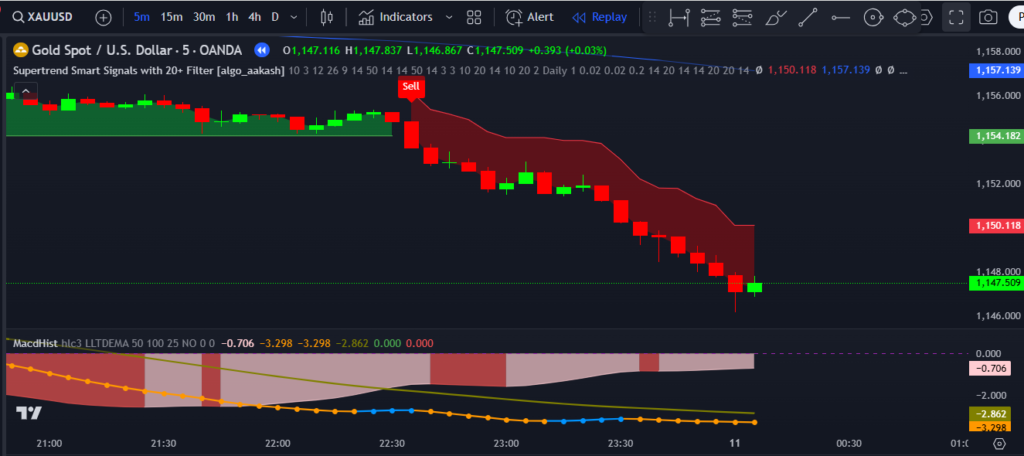
Sell Signal:
A Sell Signal occurs when the MACD line crosses below the lower Bollinger Band and the price is below the 200 EMA. This indicates that the market is experiencing strong bearish momentum, and the price is breaking through its volatility support level.
Why Use the MACD-Bollinger Bands Indicator on TradingView?
TradingView is one of the most popular charting platforms for traders and investors. It provides advanced charting tools and an easy-to-use interface that allows traders to implement their strategies effectively. By using Pine Script, TradingView’s programming language, you can create custom indicators like the MACD-Bollinger Bands Indicator with the 200 EMA filter, helping you automate your trading strategies and improve decision-making.
Benefits of Using the MACD-Bollinger Bands Indicator on TradingView:
- Clear Buy and Sell Signals: By combining the MACD with Bollinger Bands and the 200 EMA, traders receive clear and reliable signals to enter or exit trades. This helps avoid the uncertainty and confusion that often arises from using multiple indicators alone.
- Trend Confirmation: The inclusion of the 200 EMA filter ensures that you are trading in the direction of the overall market trend. This reduces the chances of entering trades during sideways or counter-trend movements, improving the probability of success.
- Customizable Alerts: TradingView allows traders to set up custom alerts when the indicator’s conditions are met. This means you can receive instant notifications for buy or sell signals without having to monitor the market constantly.
- Backtesting: TradingView offers backtesting capabilities, enabling traders to test their strategies using historical data. This feature is invaluable for assessing the performance of the MACD-Bollinger Bands Indicator with the 200 EMA filter before applying it to live trading.
Conclusion
The MACD-Bollinger Bands Indicator with 200 EMA Filter is a powerful tool for traders looking to make informed decisions based on reliable signals. By combining momentum (MACD), volatility (Bollinger Bands), and trend direction (200 EMA), this strategy offers a comprehensive approach to trading. TradingView is the perfect platform to implement this strategy using Pine Script, offering you the ability to customize, backtest, and automate your trades.
By understanding and utilizing these indicators, you can improve your trading performance, minimize risk, and maximize your potential for profit in the markets. Make sure to experiment with the strategy on TradingView and tailor it to suit your personal trading style. Happy trading!
Pinescript of MACD-Bollinger Bands Indicator
For access to this indicator, contact us at +91 7620658346. We offer custom algorithm development for TradingView, MT4/MT5, and trading bots.
Follow @algo_aakash on Instagram, YouTube, and Twitter for the latest updates.
Disclaimer
The information provided in this article and any associated indicators is for educational purposes only. Trading in financial markets involves significant risk, and there is no guarantee of profit. MACD-Bollinger Bands Indicator, which may not predict future market behavior. Users should perform their own research, assess their risk tolerance, and consult with a licensed financial advisor before making any trading decisions. The author and developer of this indicator are not responsible for any losses incurred through its use. Please trade responsibly.

0 Comments