🔓 Get All Tools for FREE!
- ✅ Click here to open a trading account using our referral link and start trading.
- 📅 After 7 days of active trading under our referral link, you can get access to all tools in your account.
- ⚠️ Keep trading to keep access free — if you're inactive for 7 days, your access will be removed.
- 👉 Already have an account? You can change the IB (introducing broker) to our referral link ( https://one.exnesstrack.org/a/w7syl3vnjb ) and still qualify!
What is the MACD BB Strategy with Trend Confirmation Indicator?
The MACD BB Strategy with Trend Confirmation is a powerful TradingView indicator designed to combine momentum, trend analysis, and risk management into one cohesive trading tool. This strategy leverages key features like the Moving Average Convergence Divergence (MACD), Bollinger Bands (BB), and a 200-period Exponential Moving Average (EMA) to provide precise buy and sell signals. Additionally, it incorporates a dynamic stop-loss (SL) and risk-reward (RR) ratio to ensure optimal trade execution and risk management.
Developed using Pine Script, this indicator is perfect for traders seeking automated solutions that align with high-momentum market conditions while filtering out weak trades during unfavorable trends.
🔓 Get All Tools for FREE!
- ✅ Click here to open a trading account using our referral link and start trading.
- 📅 After 7 days of active trading under our referral link, you can get access to all tools in your account.
- ⚠️ Keep trading to keep access free — if you're inactive for 7 days, your access will be removed.
- 👉 Already have an account? You can change the IB (introducing broker) to our referral link ( https://one.exnesstrack.org/a/w7syl3vnjb ) and still qualify!
How the MACD BB Strategy Indicator Works on TradingView
1. Indicator Calculation and Core Components
- Moving Average Convergence Divergence (MACD):
- The MACD is the heart of the strategy, offering insights into momentum and trend strength.
- Fast Length (12): A 12-period EMA of the closing price.
- Slow Length (26): A 26-period EMA of the closing price.
- MACD Line: The difference between the fast and slow EMAs.
- A rising MACD line indicates bullish momentum.
- A falling MACD line suggests bearish momentum.
- Bollinger Bands Applied to MACD:
- Bollinger Bands add a layer of volatility-based analysis to the MACD line.
- BB Period (10): A 10-period simple moving average (SMA) of the MACD line.
- Standard Deviation: Used to create upper and lower bands.
- Overbought/Oversold Levels:
- Upper Band: Signals overbought levels.
- Lower Band: Signals oversold levels.
- 200-Period EMA as a Trend Filter:
- The 200-period EMA helps identify the overarching market trend.
- Bullish Trend: When the price is above the 200 EMA.
- Bearish Trend: When the price is below the 200 EMA.
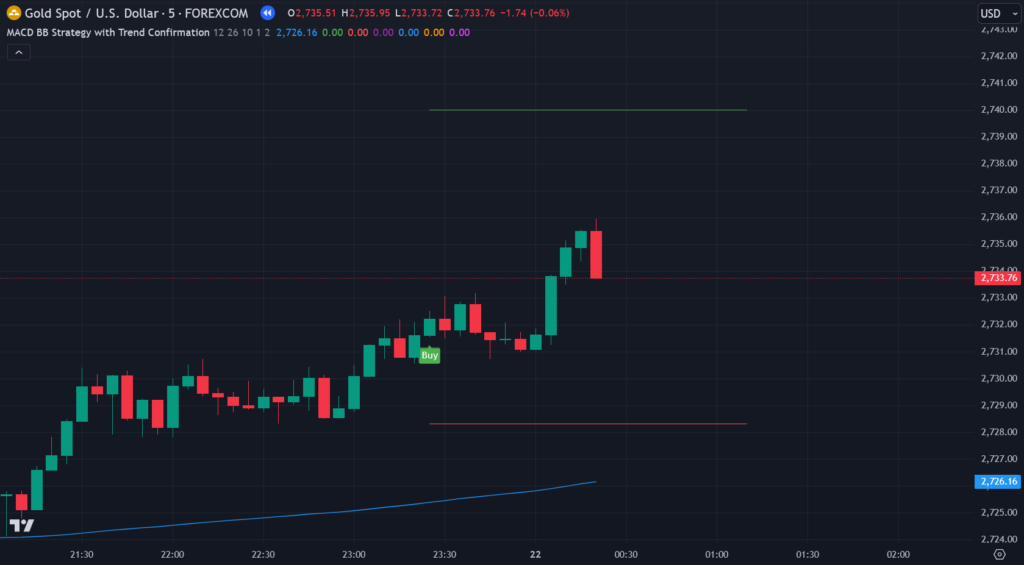
- Stop Loss (SL) and Take Profit (TP):
- Stop Loss: Dynamically set at the most recent swing high (for sell signals) or swing low (for buy signals).
- Risk-Reward Ratio (1:2): Ensures the take-profit level is twice the distance of the stop-loss, maintaining a favorable risk-reward setup.
2. Buy and Sell Signals Explained
The indicator generates buy and sell signals based on the MACD’s interaction with Bollinger Bands, filtered through the 200 EMA trend direction:
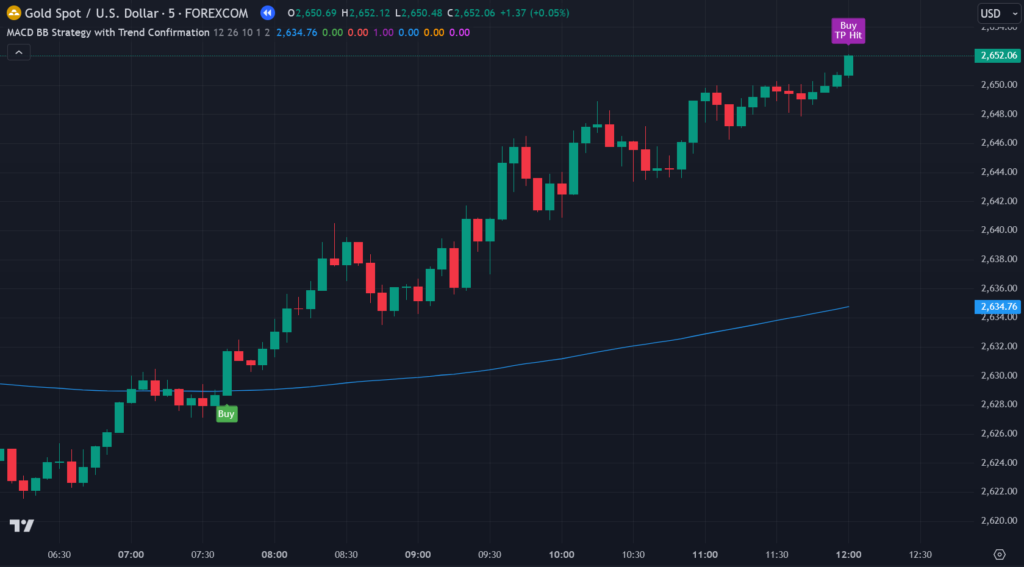
- Buy Signal:
- The MACD line crosses above the upper Bollinger Band.
- The price is above the 200 EMA, confirming an uptrend.
- Stop Loss: Set at the most recent swing low.
- Take Profit: Placed at twice the stop-loss distance (1:2 RR).
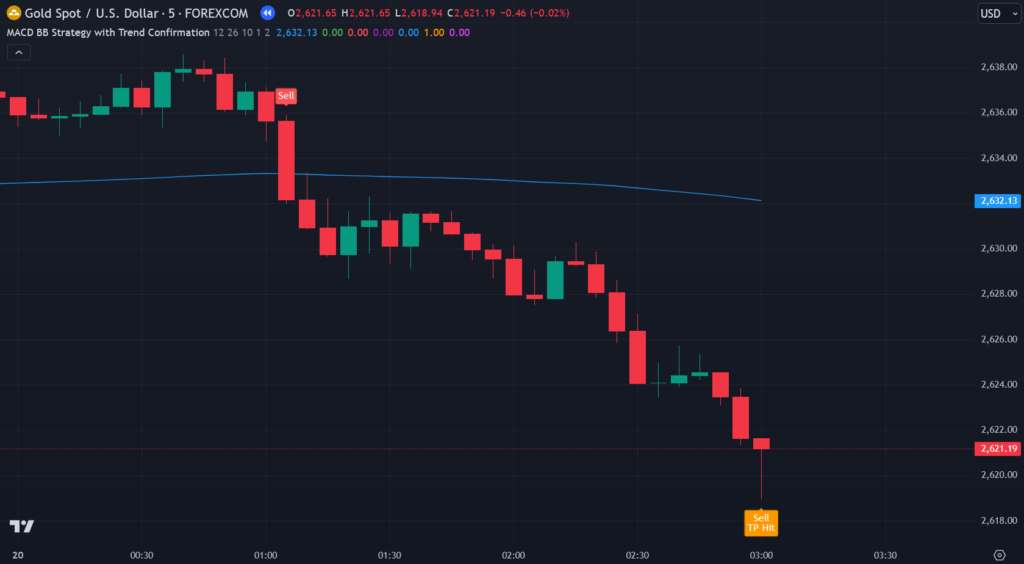
- Sell Signal:
- The MACD line crosses below the lower Bollinger Band.
- The price is below the 200 EMA, confirming a downtrend.
- Stop Loss: Set at the most recent swing high.
- Take Profit: Placed at twice the stop-loss distance (1:2 RR).
3. Benefits of Using This Indicator on TradingView
- Trend Confirmation with the 200 EMA:
The trend filter ensures trades align with the prevailing market direction, reducing the likelihood of entering against the trend. - Momentum-Based Entries with MACD and Bollinger Bands:
Combining MACD with Bollinger Bands provides precise entry points based on momentum and volatility. This helps traders capture significant breakout moves or reversal opportunities. - Dynamic Stop Loss and Take Profit:
The stop-loss adjusts dynamically to recent swing highs or lows, ensuring that each trade has a customized risk profile. The risk-reward ratio of 1:2 guarantees that profitable trades outweigh losses over time. - Automated Analysis with Pine Script:
Written in Pine Script, the indicator seamlessly integrates into TradingView, automating complex calculations and allowing traders to focus on execution rather than manual analysis.
Why Choose the MACD BB Strategy Indicator?
This indicator is ideal for traders looking for an all-in-one solution that combines trend direction, momentum signals, and robust risk management. Whether you’re trading forex, stocks, or crypto, the MACD BB Strategy Indicator offers:
- Clarity in Market Analysis: Clear buy and sell signals ensure less guesswork.
- Adaptability: Works across multiple timeframes and asset classes.
- Risk Management: Built-in SL and TP levels help control risk while maximizing profit potential.
- Ease of Use: TradingView integration ensures a user-friendly experience for both beginners and advanced traders.
Conclusion
The MACD BB Strategy with Trend Confirmation Indicator is a game-changer for traders who want precision, automation, and effective risk management in their trading arsenal. By leveraging the power of MACD, Bollinger Bands, and the 200 EMA, this TradingView indicator simplifies complex market analysis and enhances decision-making.
With Pine Script at its core, the indicator delivers a seamless and efficient trading experience, helping you capitalize on high-probability setups while minimizing risk. Add this indicator to your TradingView toolkit today and take your trading to the next level!
Pinescript of MACD BB Strategy with Trend Confirmation Indicator
Reach out to us at +91 7620658346 to access this indicator. We specialize in developing algorithms for TradingView indicators, MT4/MT5, and trading bots.
Follow @algo_aakash on Instagram, YouTube, and Twitter to stay updated!
Disclaimer
The information in this article and any associated indicators is provided for educational purposes only. Trading in financial markets involves significant risk, and there is no guarantee of profit. The custom Bollinger Band strategy is based on historical data and technical analysis, which may not accurately predict future market movements. Users are advised to conduct their own research, assess their risk tolerance, and consult with a licensed financial advisor before making any trading decisions. The author and developer of this indicator are not responsible for any losses incurred from using this strategy. Trade at your own risk.
Click here to open this indicator.
🔓 Get This Tool for FREE!
- ✅ Click here to open a trading account using our referral link and start trading.
- 💡 Use coupon code: FREE during checkout.
- 📅 After 7 days of active trading under our referral link, you’ll get access to this tool in your account.
- ⚠️ Keep trading to keep access free — if you're inactive for 7 days, your access will be removed.
- 👉 Already have an account? You can change the IB (introducing broker) to our referral link and still qualify!

0 Comments