🔓 Get All Tools for FREE!
- ✅ Click here to open a trading account using our referral link and start trading.
- 📅 After 7 days of active trading under our referral link, you can get access to all tools in your account.
- ⚠️ Keep trading to keep access free — if you're inactive for 7 days, your access will be removed.
- 👉 Already have an account? You can change the IB (introducing broker) to our referral link ( https://one.exnesstrack.org/a/w7syl3vnjb ) and still qualify!
In the world of technical analysis, indicators play a crucial role in helping traders understand market trends, identify opportunities, and make informed decisions. Among the many indicators available on TradingView, the MA Wave Indicator stands out as a unique tool for capturing short, medium, and long-term price movements. Designed using Pine Script on TradingView, the MA Wave Indicator allows traders to visualize these price movements through a combination of exponential moving averages (EMAs), helping optimize trading strategies.
In this article, we’ll dive into the workings of the MA Wave Indicator, its features, and how it can be effectively used on TradingView for better market analysis.
What is the MA Wave Indicator?

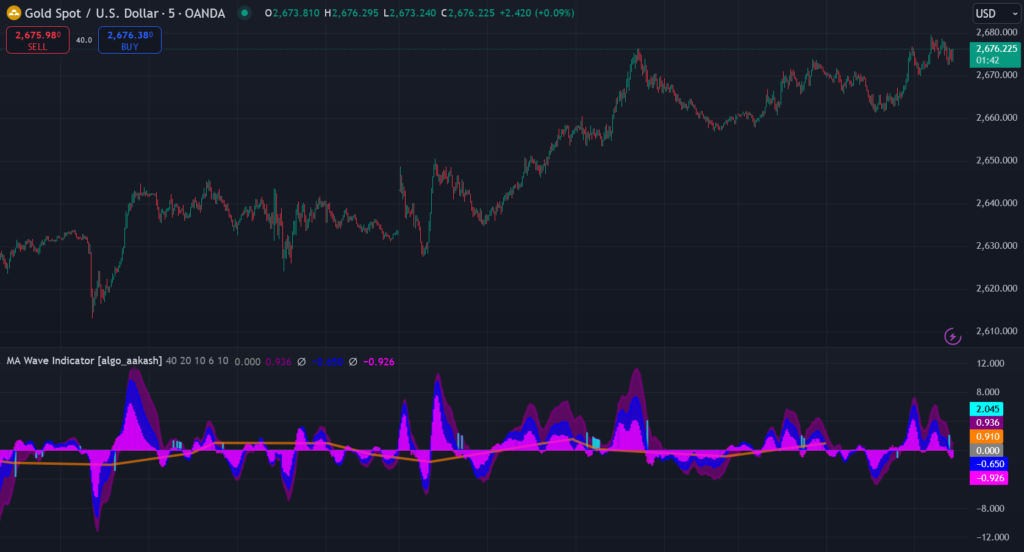
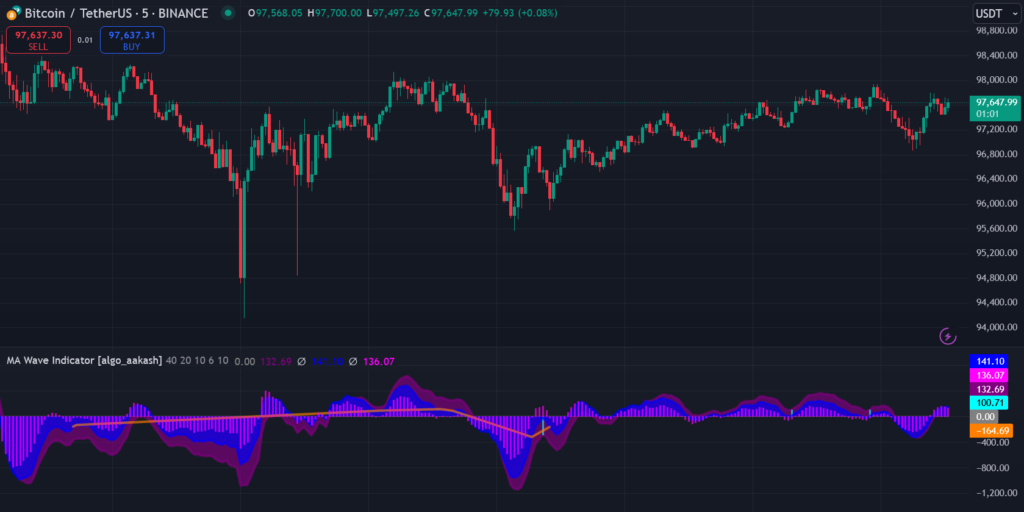
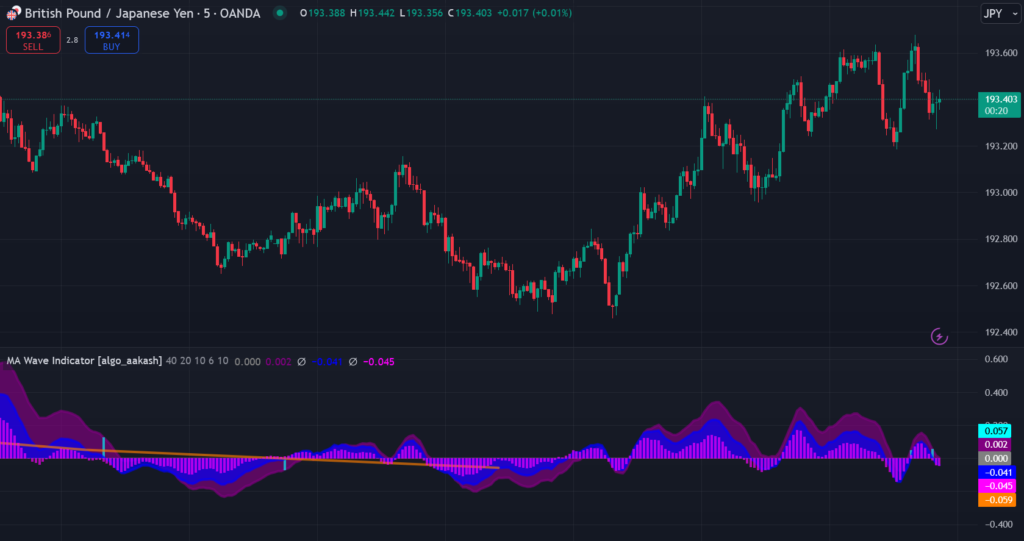
The MA Wave Indicator is an advanced technical analysis tool used to plot three waves—Wave A, Wave B, and Wave C—on a price chart. These waves represent short-term, medium-term, and long-term price movements relative to multiple exponential moving averages (EMAs) across different timeframes. The wave values are further smoothed using a simple moving average (SMA) for better clarity.
🔓 Get All Tools for FREE!
- ✅ Click here to open a trading account using our referral link and start trading.
- 📅 After 7 days of active trading under our referral link, you can get access to all tools in your account.
- ⚠️ Keep trading to keep access free — if you're inactive for 7 days, your access will be removed.
- 👉 Already have an account? You can change the IB (introducing broker) to our referral link ( https://one.exnesstrack.org/a/w7syl3vnjb ) and still qualify!
The waves plotted by the indicator offer traders valuable insights into price behavior, allowing them to gauge the market’s momentum and potential trend reversals.
How Does the MA Wave Indicator Work on TradingView?

The MA Wave Indicator works by calculating the difference between the current price and various EMAs—which are commonly used in technical analysis to identify trends over time. These differences are then plotted as waves. The three distinct waves represent the following:
- Wave A (Short-term): This wave focuses on the short-term movements of the price. It reacts quickly to small price changes and helps traders capture short-term fluctuations.
- Wave B (Medium-term): Wave B smooths out the price movements over a longer period and identifies more substantial trends that last for a medium duration.
- Wave C (Long-term): Wave C tracks the long-term movements of the price, helping traders identify the overall direction of the market over an extended period.
The indicator plots these waves on the TradingView chart, and the Zero Line serves as a baseline to gauge the strength and direction of the waves. The zero line makes it easier for traders to visualize whether the market is in an uptrend or downtrend based on the position of the waves.
Key Features of the MA Wave Indicator
- Wave A, B, and C:
- As mentioned, these waves represent price movements over short, medium, and long durations. The MA Wave Indicator automatically calculates and plots these waves, giving traders a clear view of how the market is moving over different timeframes.
- Spike Detection:
- One of the standout features of the MA Wave Indicator is its spike detection capability. When the ratio of the waves exceeds a predefined threshold, significant spikes are highlighted. These spikes can indicate moments of high volatility, exhaustion points, or potential reversals in the market. By identifying such spikes, traders can spot critical turning points that may signal opportunities for entering or exiting trades.
- Zero Line:
- The zero line serves as a baseline for analyzing wave movements. When the waves are above the zero line, the market is generally in an uptrend, and when the waves are below the zero line, it suggests a downtrend. This simple yet effective feature helps traders visualize trend strength and direction quickly.
How the MA Wave Indicator Helps Traders
The MA Wave Indicator on TradingView can be a powerful tool in a trader’s arsenal. Here’s how it can be useful in different aspects of trading:
1. Trend Identification:
One of the primary uses of the MA Wave Indicator is for trend identification. By analyzing the position of Wave A, Wave B, and Wave C relative to the zero line, traders can quickly determine whether the market is in an uptrend, downtrend, or sideways movement.
- Bullish Trend: When the waves are above the zero line and gradually increasing, it suggests that the market is trending upward, and traders can consider long positions.
- Bearish Trend: If the waves are below the zero line and gradually decreasing, it indicates a bearish trend, and traders may look for short positions.
- Sideways Movement: When the waves oscillate around the zero line without clear direction, it signals consolidation, where traders might avoid taking positions or trade within a range.
2. Spike Detection and Market Reversals:
The spike detection feature in the MA Wave Indicator is incredibly useful for recognizing market reversals or exhaustion points. Spikes are often associated with increased volatility, which can signal a potential trend reversal or the end of a strong price movement.
When the waves exceed a predefined ratio threshold, highlighting these spikes can give traders an early indication that the market is about to change direction. Spotting such moments enables traders to adjust their positions, set stop-loss orders, or time their entries and exits with better precision.
3. Market Timing:
By using the MA Wave Indicator, traders can optimize their entry and exit points. The indicator’s ability to track short-term, medium-term, and long-term trends allows traders to fine-tune their trades based on the wave movements.
For example:
- A crossing of Wave A above Wave B may indicate a potential buy signal, especially if accompanied by a spike detection.
- A crossing of Wave A below Wave B could be an early sell signal.
These insights help traders make timely decisions, enhancing their chances of maximizing profits.
Conclusion
The MA Wave Indicator, built with Pine Script, is an excellent tool for traders on TradingView who seek to understand the market’s behavior across different timeframes. With its ability to plot three distinct waves representing short, medium, and long-term price movements, the indicator provides a comprehensive view of the market trend.
Moreover, the spike detection feature enhances its effectiveness, allowing traders to pinpoint key moments when the market may be about to reverse. Whether you’re a day trader, swing trader, or long-term investor, the MA Wave Indicator offers valuable insights to help you make better trading decisions.
By integrating this tool into your TradingView charting setup, you can gain a competitive edge in understanding market movements, timing your trades, and optimizing your trading strategy.
Pinescript of MA Wave Indicator on TradingView

To access this indicator, contact us at +91 7620658346. We specialize in algorithm development for TradingView, MT4/MT5, and trading bots.
Follow us on Instagram, YouTube, and Twitter @algo_aakash for more updates!
Disclaimer
The information provided in this article and any related indicators is for educational purposes only. Trading in financial markets carries significant risk, and there are no guarantees of profit. The custom Bollinger Band strategy is based on historical data and technical analysis, which may not accurately predict future market movements. Users should conduct their own research, evaluate their risk tolerance, and consult a licensed financial advisor before making any trading decisions. The author and developer of this indicator are not responsible for any losses incurred from using this strategy. Trade responsibly.

0 Comments