🔓 Get All Tools for FREE!
- ✅ Click here to open a trading account using our referral link and start trading.
- 📅 After 7 days of active trading under our referral link, you can get access to all tools in your account.
- ⚠️ Keep trading to keep access free — if you're inactive for 7 days, your access will be removed.
- 👉 Already have an account? You can change the IB (introducing broker) to our referral link ( https://one.exnesstrack.org/a/w7syl3vnjb ) and still qualify!
In the world of technical analysis, traders use various indicators to predict market movements and make informed decisions. One powerful combination is the Linear Regression and Exponential Moving Average (EMA) indicators. When integrated into platforms like TradingView with PineScript, they offer a robust framework for identifying trade opportunities.
This guide dives into the Linear Regression + EMA TradingView indicator, explaining how it works, its setup, and how you can leverage it for efficient trading.
What is the Linear Regression + EMA Indicator?
The Linear Regression indicator is used to identify the general trend of the market by fitting a linear line through a series of data points. This trend line is useful in understanding market momentum and anticipating future price movements.
🔓 Get All Tools for FREE!
- ✅ Click here to open a trading account using our referral link and start trading.
- 📅 After 7 days of active trading under our referral link, you can get access to all tools in your account.
- ⚠️ Keep trading to keep access free — if you're inactive for 7 days, your access will be removed.
- 👉 Already have an account? You can change the IB (introducing broker) to our referral link ( https://one.exnesstrack.org/a/w7syl3vnjb ) and still qualify!
On the other hand, the Exponential Moving Average (EMA) places more weight on recent price data, making it more responsive to price changes than the Simple Moving Average (SMA). When combined with Linear Regression, it creates a powerful tool that helps identify market trends and potential reversal points.
How Does the Linear Regression + EMA Indicator Work on TradingView?
In TradingView, you can integrate this combination using PineScript, TradingView’s own scripting language designed for creating custom indicators and strategies. By combining the Linear Regression with the EMA, this indicator provides a dual approach to trend analysis, ensuring that traders are well-equipped to make high-probability trading decisions.
Here’s how the indicator functions:
- Linear Regression (L1): This adjusted line is drawn based on past price action, giving traders a visual representation of the market’s prevailing trend. The Linear Regression line helps smooth out price data, making it easier to spot long-term trends.
- EMA (Exponential Moving Average): The EMA reacts more quickly to price changes. By using an L1 Linear Regression-Adjusted EMA, it integrates the best features of both indicators. The EMA will adjust faster to price shifts, allowing for quicker responses to market changes while maintaining the smoothing capabilities of Linear Regression.
Indicator Setup on TradingView
The setup of the Linear Regression + EMA indicator on TradingView involves using specific custom indicators and creating a script in PineScript.
Step 1: Add the [blackcat] L1 Linear Regression-Adjusted EMA
To start, add the [blackcat] L1 Linear Regression-Adjusted EMA indicator to your TradingView chart. This indicator is designed to provide a smoothed and adjusted EMA line that reflects the overall market trend. It uses the Linear Regression principle to filter out noise from the market, helping traders better visualize price trends.
Step 2: Integrate the RedK_Directional Index
The RedK_Directional Index is used to assess market strength and direction. It helps traders determine whether the market is in a strong uptrend, downtrend, or sideways. The Directional Index can give additional confirmation to your trades when paired with the Linear Regression-Adjusted EMA.
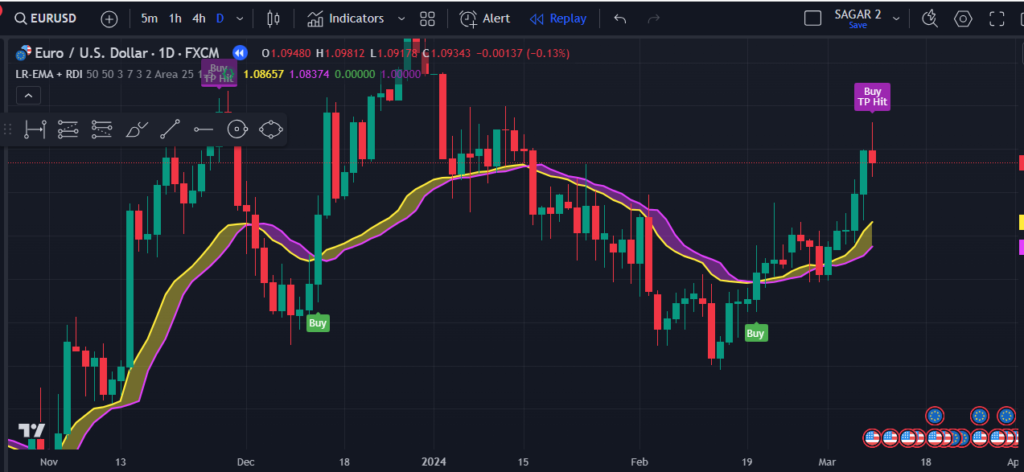
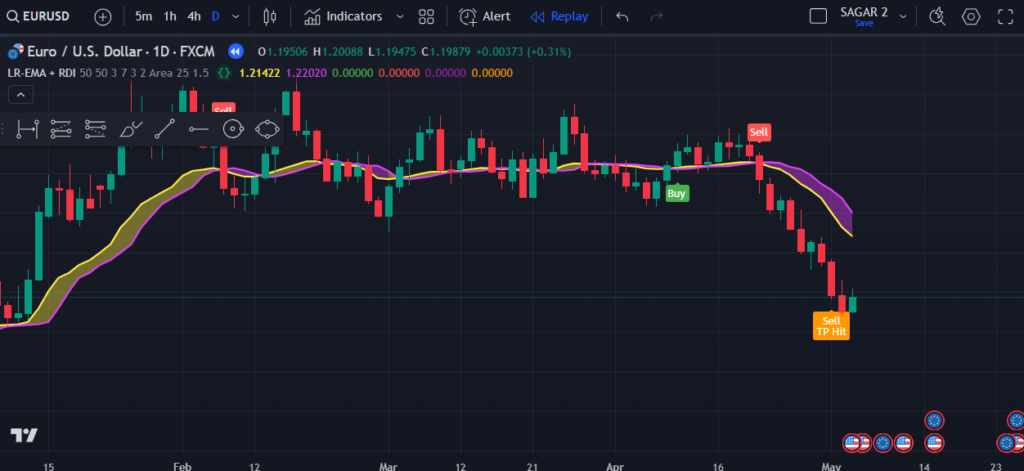
- Buy Signal: When the price is above the L1 Linear Regression-Adjusted EMA line and the RedK_Directional Index (ADX) is green, it signals a potential buy opportunity. This suggests that the market is in a strong uptrend and likely to continue.
- Sell Signal: Conversely, when the price is below the L1 Linear Regression-Adjusted EMA line and the ADX is red, it signals a potential sell opportunity, indicating a downtrend.
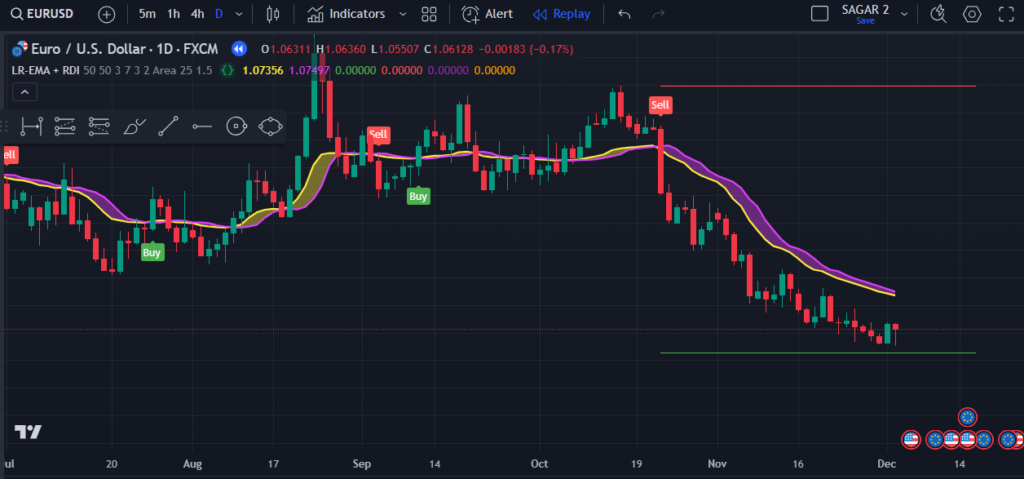
Step 3: Setting Stop Loss and Risk-Reward Ratio
- Stop Loss (SL): The Stop Loss should be set at the most recent swing low for a buy trade or the swing high for a sell trade. This helps protect your position in case the market moves against your trade.
- Risk-Reward Ratio (RR): A common Risk-Reward Ratio used with this strategy is 1:1.5. This means that for every 1 unit of risk, you’re aiming to make 1.5 units of profit.
Benefits of Using the Linear Regression + EMA Indicator
- Trend Identification: The combination of the L1 Linear Regression and EMA helps you identify prevailing market trends, whether bullish or bearish. The EMA adjusts quickly to price changes, while the Linear Regression line smooths out the data for a clearer view of the overall trend.
- Trade Confirmation: The RedK_Directional Index acts as a confirmation tool, ensuring that the market direction aligns with the trade signal. This adds an extra layer of confidence when entering trades.
- Clear Buy/Sell Signals: By using the Linear Regression-Adjusted EMA line along with the ADX, you can clearly identify entry points for buying or selling, minimizing confusion and improving the accuracy of your trades.
- Easy Customization: Since TradingView supports PineScript, you can easily adjust the settings of this indicator according to your trading strategy. You can experiment with different time frames, EMA periods, and other parameters to fine-tune the indicator for optimal performance.
How to Use the Linear Regression + EMA Indicator for Effective Trading
To use the Linear Regression + EMA indicator effectively, follow these steps:
- Watch for Trend Direction: Start by observing whether the price is above or below the L1 Linear Regression-Adjusted EMA. This helps you quickly determine if the market is trending upwards or downwards.
- Wait for Confirmation: Look for confirmation from the RedK_Directional Index (ADX). If the ADX is green, you are in a strong uptrend, which signals a buy. If the ADX is red, the trend is bearish, and you should look for sell signals.
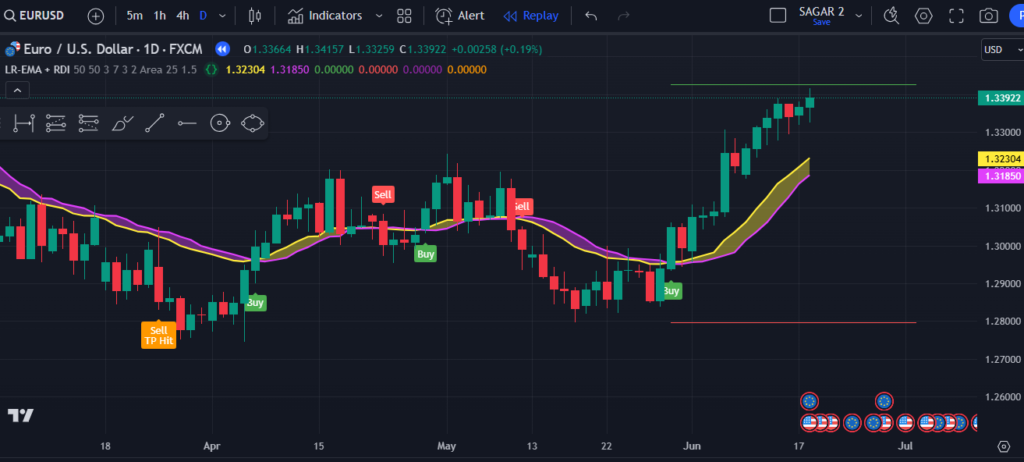
- Set Your Stop Loss and Risk-Reward Ratio: Before entering the trade, set your Stop Loss at the most recent swing low (for a buy) or swing high (for a sell). Then, determine your Risk-Reward Ratio—aiming for a 1:1.5 ratio.
- Monitor the Trade: Keep an eye on the trade and be ready to adjust your position if the trend changes. The Linear Regression-Adjusted EMA will adjust to price shifts, helping you decide when to exit the trade or stay in it.
Conclusion
The Linear Regression + EMA TradingView Indicator is a powerful tool for traders seeking to identify clear trends and make informed trading decisions. By combining the Linear Regression principle with the Exponential Moving Average, this indicator provides smooth trend analysis while also being highly responsive to price changes.
By integrating the RedK_Directional Index and using PineScript on TradingView, traders can confidently make buy or sell decisions, set effective stop losses, and ensure a risk-reward ratio that maximizes profits. Whether you’re a beginner or an experienced trader, this indicator can significantly improve your trading strategy and outcomes.
Make sure to experiment with this setup on TradingView and adjust it according to your trading style for the best results.
Pinescript of Liner Regression + EMA TradingView Indicator :
Access this premium indicator today by reaching out at +91 7620658346! We specialize in developing custom TradingView indicators, MT4/MT5 strategies, and trading bots.
Follow us on Instagram, YouTube, and Twitter: @algo_aakash for updates and expert trading tips!
Disclaimer
The content in this article and any associated indicators is for educational purposes only. Trading in financial markets involves significant risk, and there is no assurance of profit. The custom Bollinger Band strategy is based on historical data and technical analysis, which may not predict future market outcomes. Users should conduct their own research, evaluate their risk tolerance, and consult with a licensed financial advisor before making any trading decisions. The author and developer of this indicator are not responsible for any losses incurred through the use of this strategy. Please trade responsibly.

0 Comments