🔓 Get All Tools for FREE!
- ✅ Click here to open a trading account using our referral link and start trading.
- 📅 After 7 days of active trading under our referral link, you can get access to all tools in your account.
- ⚠️ Keep trading to keep access free — if you're inactive for 7 days, your access will be removed.
- 👉 Already have an account? You can change the IB (introducing broker) to our referral link ( https://one.exnesstrack.org/a/w7syl3vnjb ) and still qualify!
In the world of trading, identifying trends and understanding market momentum is key to making successful decisions. One of the most popular tools for trend analysis is the Exponential Moving Average (EMA). However, relying on a single EMA may not provide a comprehensive picture of the market. This is where the Enhanced EMA’s Indicator comes into play. It is designed to offer a clearer, more dynamic way to analyze market trends using multiple EMAs in one tool, enhancing both visual clarity and analytical accuracy.
What is the Enhanced EMA’s Indicator?
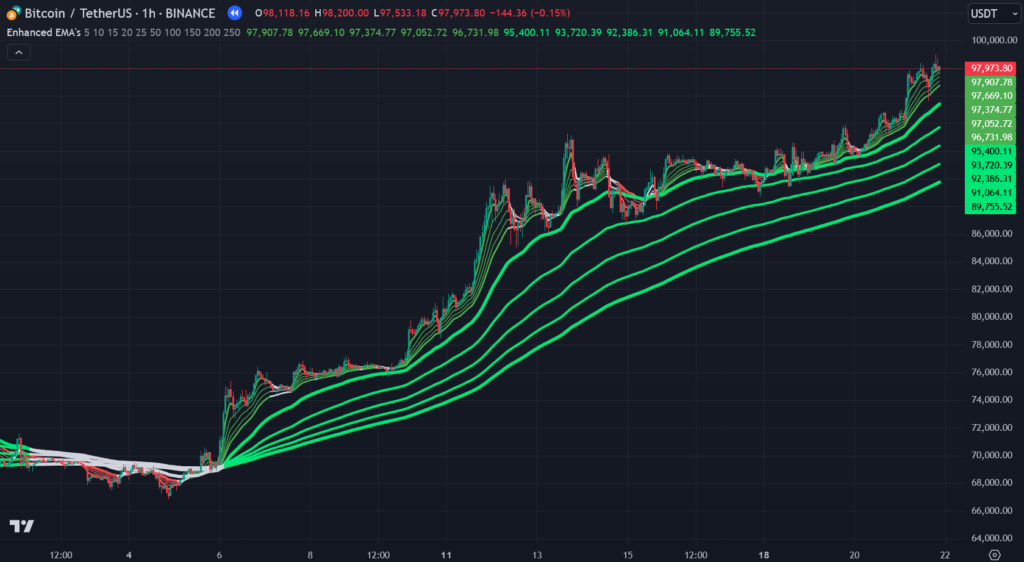
The Enhanced EMA’s Indicator is a powerful tool on TradingView that combines multiple Exponential Moving Averages (EMAs) into one advanced indicator. By integrating different EMAs, this tool helps traders better understand market trends, making it easier to time entries and exits. The indicator uses dynamic color coding and gradient fills to visually represent different market conditions, such as uptrends and downtrends, based on both fast and slow EMAs.
🔓 Get All Tools for FREE!
- ✅ Click here to open a trading account using our referral link and start trading.
- 📅 After 7 days of active trading under our referral link, you can get access to all tools in your account.
- ⚠️ Keep trading to keep access free — if you're inactive for 7 days, your access will be removed.
- 👉 Already have an account? You can change the IB (introducing broker) to our referral link ( https://one.exnesstrack.org/a/w7syl3vnjb ) and still qualify!
The Enhanced EMA’s Indicator is highly customizable, allowing traders to toggle individual EMAs on or off, and adjust their lengths. It creates a comprehensive visual display that enables traders to instantly identify market movements, providing critical insights into potential trading opportunities.
Key Features of the Enhanced EMA’s Indicator
1. Customizable EMAs
The Enhanced EMA’s Indicator allows you to toggle between different EMAs (fast and slow), and customize their lengths to suit your trading strategy. Whether you’re focusing on short-term price action or long-term trends, you can adjust the indicator’s settings to match your trading style and asset preferences.
- Fast EMAs: These EMAs represent short-term price action. They respond quickly to price changes, giving traders an indication of the immediate market sentiment.
- Slow EMAs: These EMAs represent long-term price trends and offer insights into the overall market structure. The slow EMAs move more gradually, providing a broader perspective on the trend.
2. Trend Detection
The Enhanced EMA’s Indicator uses color-coded EMAs to help traders identify trends at a glance.
- Fast EMAs: These EMAs turn green when the market is in an uptrend, and red when the market is in a downtrend. This allows traders to quickly spot shifts in momentum.
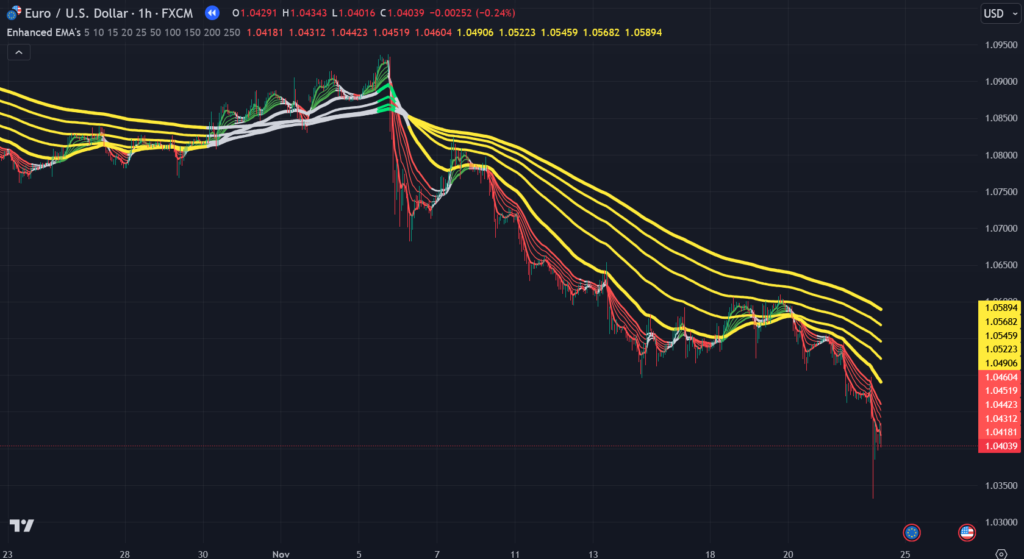
- Slow EMAs: Slow EMAs use lime for a strong uptrend and yellow for a strong downtrend, adding another layer of trend confirmation. This dual EMA system makes it easier to distinguish between short-term price action and longer-term trends.
3. Momentum Analysis
By separating fast and slow EMAs, this indicator makes it easier to assess both short-term momentum and long-term market strength. This distinction is critical for making informed trading decisions, especially when you’re deciding whether to enter or exit a trade based on the prevailing market momentum.
4. Visual Clarity
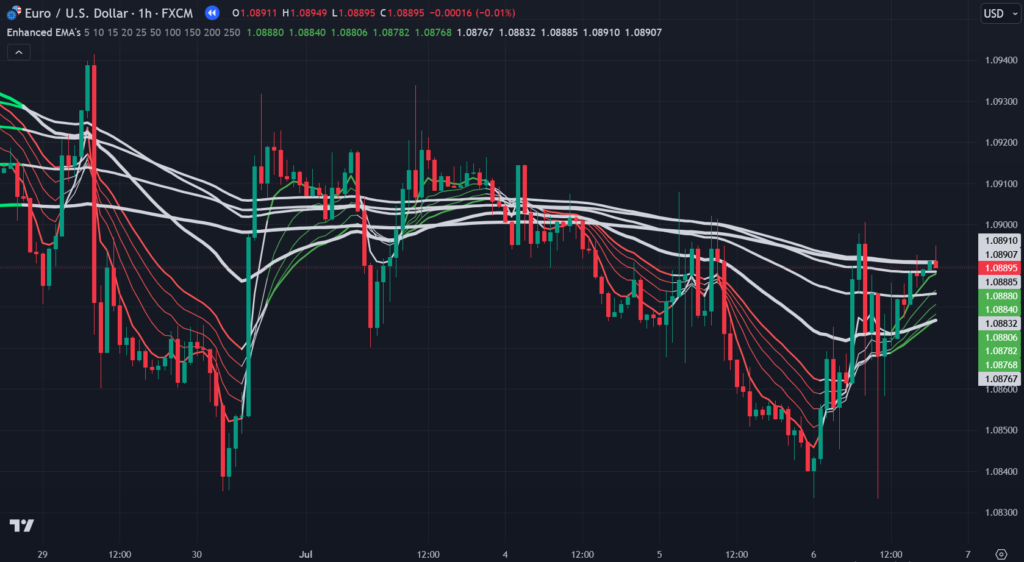
The Enhanced EMA’s Indicator employs gradient fills that highlight the confluence zones where both fast and slow EMAs align, offering a clear visual representation of key market conditions. These zones make it easy to spot areas of trend reversal or continuation, aiding in effective decision-making.
How Enhanced EMA’s Indicator Works on TradingView
Step 1: Setting Up the Enhanced EMA’s Indicator
To use the Enhanced EMA’s Indicator on TradingView, you need to add it to your chart. Here’s how you can do it:
- Open TradingView and select the chart of the asset you want to analyze.
- Go to the Indicators section, search for the “Enhanced EMA’s Indicator,” and click to add it to your chart.
- Once added, you can customize the indicator by adjusting the lengths of the fast and slow EMAs. You can also toggle them on or off depending on whether you want to analyze short-term or long-term trends.
Step 2: Interpreting the Colors and Signals
After adding the indicator to your chart, you will notice the color-coded EMAs. Here’s how to interpret them:
- Green Fast EMA: The market is in a bullish trend.
- Red Fast EMA: The market is in a bearish trend.
- Lime Slow EMA: A strong uptrend is in place.
- Yellow Slow EMA: A strong downtrend is in play.
The gradient fills will highlight areas where both EMAs are aligned, signaling potential confluence zones, helping traders to make more informed decisions.
Step 3: Using the Indicator for Entries and Exits
The Enhanced EMA’s Indicator is a useful tool for trend-following strategies. Traders can use the color changes in the EMAs to time their entries and exits. For example:
- Entering a Trade: A green fast EMA crossing above a lime slow EMA signals a strong uptrend, making it a potential buying opportunity.
- Exiting a Trade: Conversely, a red fast EMA crossing below a yellow slow EMA signals a bearish reversal, indicating it might be time to exit or even go short.
Usefulness in Trading
Trend Identification
The Enhanced EMA’s Indicator is an excellent tool for trend identification. By using multiple EMAs, it gives traders a broader perspective on market direction, helping them distinguish between short-term fluctuations and long-term trends. The color-coded fast and slow EMAs allow traders to quickly recognize bullish or bearish trends, making it easier to time trades effectively.
Momentum Analysis
With separate short-term (fast) and long-term (slow) EMAs, the indicator provides a detailed view of market momentum. This is crucial for assessing whether the market is in a strong trend or just experiencing temporary fluctuations. Traders can use the information to refine their entry points, reduce risk, and enhance their trading decisions.
Flexibility
The ability to customize the indicator’s settings allows traders to tailor it to various assets and timeframes. Whether you’re trading stocks, forex, or cryptocurrencies, and whether you prefer short-term scalping or long-term investing, the Enhanced EMA’s Indicator can be adjusted to suit your strategy.
Visual Clarity
The gradient fills and color changes in the EMAs make it easier for traders to identify confluence zones, trend reversals, and market momentum. This added visual clarity can significantly improve decision-making and help avoid the confusion that often comes with traditional indicators.
Conclusion
The Enhanced EMA’s Indicator is a powerful tool on TradingView that simplifies trend and momentum analysis. By using multiple EMAs with dynamic color coding and gradient fills, it helps traders identify market trends quickly and effectively. Whether you’re looking for a more advanced tool for trend-following or want to improve your entry and exit strategies, the Enhanced EMA’s Indicator is a must-have tool for any trader. With its flexibility, visual clarity, and ease of use, this indicator can significantly enhance your trading experience and decision-making process.
Pinescript of Enhanced EMA’s TradingView Indicator
For access to this indicator, contact us at +91 7620658346. We offer custom algorithm development for TradingView, MT4/MT5, and trading bots.
Stay connected with us on Instagram, YouTube, and Twitter @algo_aakash.
Disclaimer
The information provided in this article and any associated indicators is for educational purposes only. Trading financial markets involves substantial risk, and profits are not guaranteed. The custom Bollinger Band strategy is based on historical data and technical analysis, which may not accurately predict future market behavior. Users should conduct their own research, assess their risk tolerance, and consult with a licensed financial advisor before making any trading decisions. The author and developer of this indicator are not responsible for any losses incurred through the use of this strategy. Please trade at your own risk.
Click here to interact with the feature.
🔓 Get This Tool for FREE!
- ✅ Click here to open a trading account using our referral link and start trading.
- 💡 Use coupon code: FREE during checkout.
- 📅 After 7 days of active trading under our referral link, you’ll get access to this tool in your account.
- ⚠️ Keep trading to keep access free — if you're inactive for 7 days, your access will be removed.
- 👉 Already have an account? You can change the IB (introducing broker) to our referral link and still qualify!

0 Comments