🔓 Get All Tools for FREE!
- ✅ Click here to open a trading account using our referral link and start trading.
- 📅 After 7 days of active trading under our referral link, you can get access to all tools in your account.
- ⚠️ Keep trading to keep access free — if you're inactive for 7 days, your access will be removed.
- 👉 Already have an account? You can change the IB (introducing broker) to our referral link ( https://one.exnesstrack.org/a/w7syl3vnjb ) and still qualify!
What is the EMA 50 + EMA 200 + Volume Strategy Indicator on TradingView?
In the world of trading, indicators serve as crucial tools for providing traders with clear signals to guide their decision-making. One such indicator is the EMA 50 + EMA 200 + Volume strategy, which combines two key moving averages — the Exponential Moving Average (EMA) 50 and EMA 200 — with a Volume SMA 9 to create buy and sell signals. This indicator is available on TradingView and can be easily customized using Pine Script to suit individual trading strategies.
In this article, we will explain what the EMA 50 + EMA 200 + Volume strategy is, how it works, and how you can set it up on TradingView using Pine Script. We will also look at how this indicator can improve your trading decisions and provide clear entry and exit points.
🔓 Get All Tools for FREE!
- ✅ Click here to open a trading account using our referral link and start trading.
- 📅 After 7 days of active trading under our referral link, you can get access to all tools in your account.
- ⚠️ Keep trading to keep access free — if you're inactive for 7 days, your access will be removed.
- 👉 Already have an account? You can change the IB (introducing broker) to our referral link ( https://one.exnesstrack.org/a/w7syl3vnjb ) and still qualify!
Indicator Overview:
The EMA 50 + EMA 200 + Volume strategy is a simple yet powerful tool that utilizes a combination of two moving averages (50-period and 200-period EMAs) along with a 9-period simple moving average (SMA) of volume. This strategy is designed to identify the overall trend and provide buy and sell signals based on price action and volume analysis.
Key Components:
- EMA 50 (Green Line): This is a shorter-term exponential moving average that reacts more quickly to price changes. The EMA 50 is often used to track the medium-term trend of an asset.
- EMA 200 (Red Line): This is a longer-term exponential moving average that provides a more reliable indication of the long-term trend. It smooths out the price fluctuations, allowing traders to assess the overall trend with more accuracy.
- Volume SMA 9: The volume SMA 9 is a simple moving average of the volume for the past 9 periods. It helps confirm the strength of a price move by considering how much volume is accompanying the price action.
How the EMA 50 + EMA 200 + Volume Strategy Indicator Indicator Works on TradingView:
The EMA 50 + EMA 200 + Volume strategy is designed to provide clear buy and sell signals based on the interaction between the two EMAs and volume levels. Here’s how the system works:
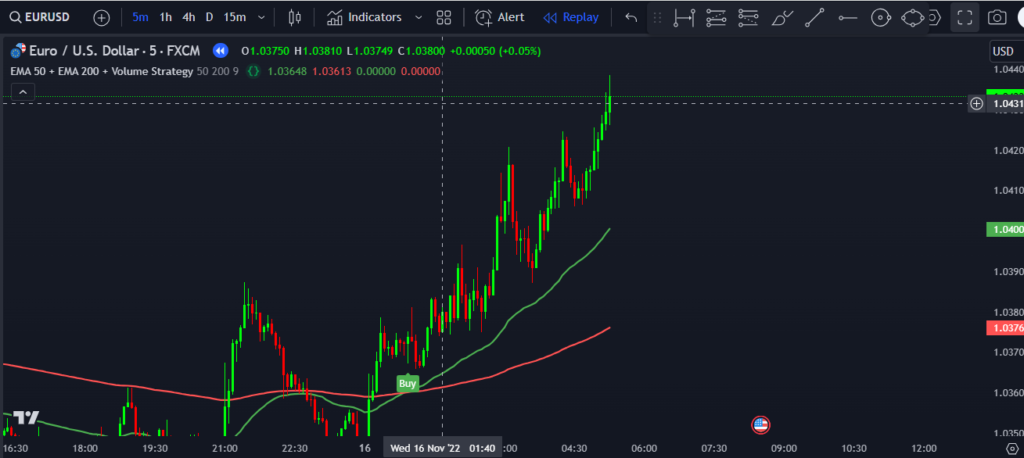
- Buy Signal:
- A buy signal is triggered when the EMA 50 (green line) crosses above the EMA 200 (red line). This crossover indicates a potential upward trend, suggesting that the price may continue rising.
- The confirmation of this buy signal is strengthened by an increase in volume, as the volume SMA 9 ensures that there is sufficient market interest and momentum to support the price move.
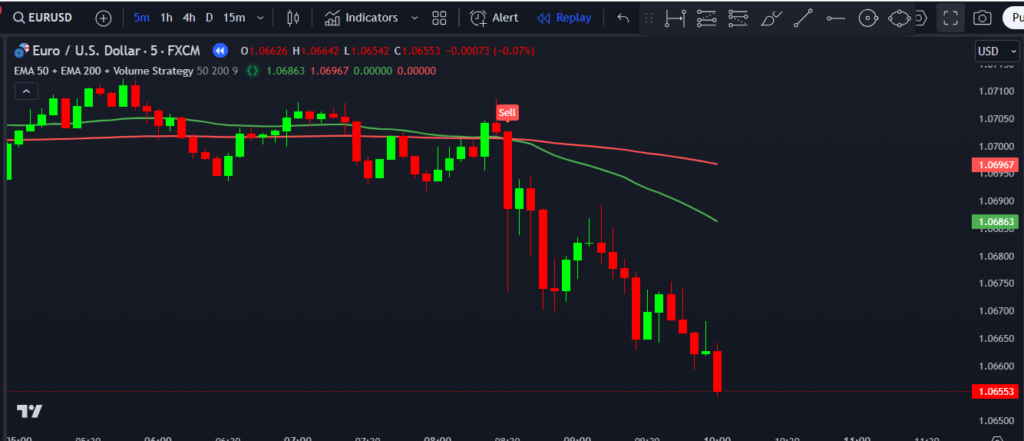
- Sell Signal:
- Conversely, a sell signal is generated when the EMA 50 (green line) crosses below the EMA 200 (red line). This suggests a potential downward trend, where the price may continue to fall.
- As with the buy signal, the sell signal is more reliable when volume confirms the price movement, ensuring that there is enough market activity to drive the price down.
The combination of the EMA crossovers and volume confirmation creates a robust strategy for identifying both bullish and bearish market trends. The TradingView platform is an ideal space to implement and visualize this indicator, as it allows for easy customization using Pine Script, the platform’s scripting language.
Setting Up the Indicator on TradingView Using Pine Script:
To use the EMA 50 + EMA 200 + Volume strategy on TradingView, follow these steps to set up the indicator using Pine Script:
- Open TradingView:
- Log in to your TradingView account. If you don’t have one, you can create a free account to get started.
- Create a New Script:
- Go to the Pine Script Editor on TradingView.
- Click on “New” to create a new script.
- Input the Pine Script Code:
- Below is the Pine Script code for the EMA 50 + EMA 200 + Volume strategy.
- Apply the Indicator to Your Chart:
- After inputting the script, click “Add to Chart” to apply the indicator to your chart.
- You will now see the EMA 50 (green line) and EMA 200 (red line) plotted on the price chart, along with the Volume SMA 9 indicator. The buy and sell signals will also appear as labels on the chart when the respective conditions are met.
How to Use the Indicator for Trading:
- Trend Identification:
- Use the EMA 50 and EMA 200 to determine the overall trend. If the EMA 50 is above the EMA 200, it indicates a bullish trend, and if the EMA 50 is below the EMA 200, it indicates a bearish trend.
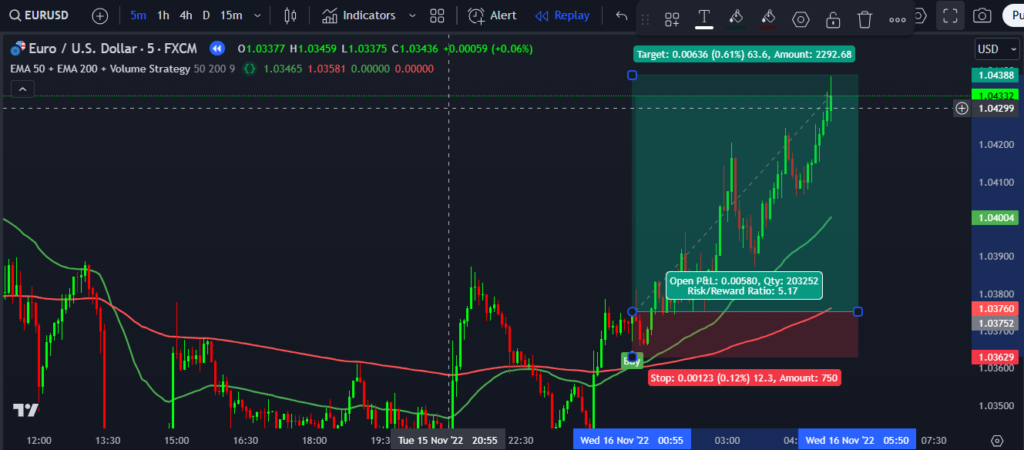
- Entry Points:
- Buy when the EMA 50 crosses above the EMA 200, and confirm the signal with an increase in volume.
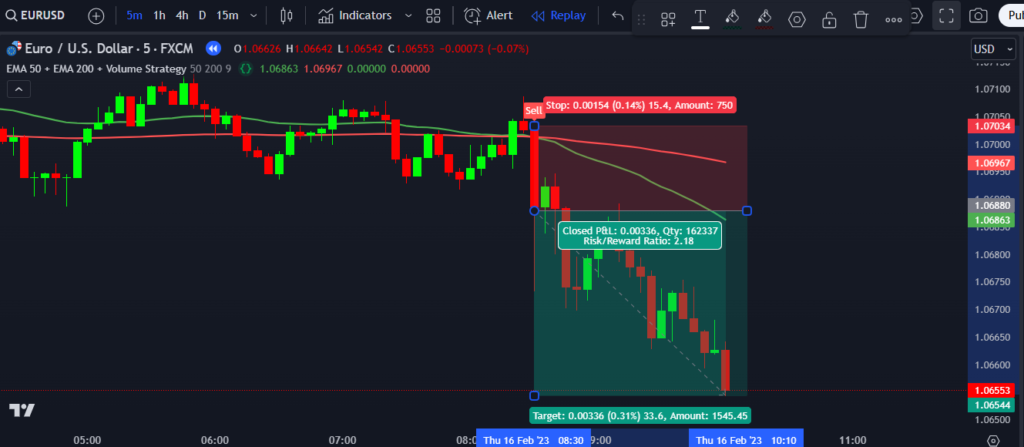
- Sell when the EMA 50 crosses below the EMA 200, and confirm the signal with a decrease in volume.
- Volume Confirmation:
- Use the Volume SMA 9 to confirm the strength of the move. Higher volume during a crossover indicates stronger market interest and increases the reliability of the signal.
Conclusion:
The EMA 50 + EMA 200 + Volume strategy is a simple yet effective trading indicator on TradingView that combines the power of moving averages and volume analysis. By using Pine Script, you can customize and apply this strategy to your chart for clear buy and sell signals. Whether you’re a beginner or an experienced trader, this strategy can help you identify the overall trend, enter trades at the right time, and manage risk effectively.
By combining the EMA crossovers with volume analysis, this indicator enhances your decision-making process and increases the likelihood of successful trades.
Pinescript of EMA 50 + EMA 200 + Volume Strategy Indicator on TradingView
To access this indicator, contact us at +91 7620658346. We offer custom algorithm development for TradingView, MT4/MT5, and trading bots.
Stay connected with @algo_aakash on Instagram, YouTube, and Twitter for updates.
Disclaimer
The information in this article and any related indicators is for educational purposes only. Trading in financial markets carries a high level of risk, and there is no guarantee of profit. EMA 50 + EMA 200 + Volume Strategy Indicator on TradingView, which may not necessarily predict future market movements. Users should conduct their own research, assess their risk tolerance, and consult a licensed financial advisor before making any trading decisions. The author and developer of this indicator are not responsible for any losses incurred through its use. Please trade responsibly.

1 Comment
Murodilla · December 22, 2024 at 4:10 pm
Making a stable income