🔓 Get All Tools for FREE!
- ✅ Click here to open a trading account using our referral link and start trading.
- 📅 After 7 days of active trading under our referral link, you can get access to all tools in your account.
- ⚠️ Keep trading to keep access free — if you're inactive for 7 days, your access will be removed.
- 👉 Already have an account? You can change the IB (introducing broker) to our referral link ( https://one.exnesstrack.org/a/w7syl3vnjb ) and still qualify!
What is the Support & Resistance Enhanced Tradingview Indicator
In the world of trading, support and resistance levels are fundamental concepts that help traders make informed decisions. However, manually identifying these levels can be challenging, especially when markets are volatile. This is where a dynamic Support and Resistance indicator for TradingView comes into play. Developed using Pine Script, the TradingView scripting language, this indicator automatically identifies key support and resistance levels and trade zones based on price highs and lows over a defined lookback period.
This custom indicator doesn’t just plot static lines; it dynamically adjusts the support and resistance levels as the price action evolves. It also highlights trade zones between these levels, showing potential areas where price is likely to either reverse or continue its trend. This makes the indicator invaluable for traders who are looking for high-probability entry and exit points, risk management, and precise trade planning.
🔓 Get All Tools for FREE!
- ✅ Click here to open a trading account using our referral link and start trading.
- 📅 After 7 days of active trading under our referral link, you can get access to all tools in your account.
- ⚠️ Keep trading to keep access free — if you're inactive for 7 days, your access will be removed.
- 👉 Already have an account? You can change the IB (introducing broker) to our referral link ( https://one.exnesstrack.org/a/w7syl3vnjb ) and still qualify!
Explanation of the Indicator
The core functionality of this indicator revolves around identifying support and resistance levels that are not fixed but adapt to changing price movements. These levels are plotted dynamically on the chart, giving traders a real-time view of key price points where price could potentially reverse. By incorporating price highs and lows over a set lookback period, the indicator calculates the most relevant support and resistance levels.
Additionally, the indicator helps traders identify trade zones, which are regions between support and resistance. These zones indicate areas where the price might retrace, making them crucial for planning entries and exits. It’s especially useful when traders want to time their trades more effectively during consolidations or trend pullbacks.
Key Features
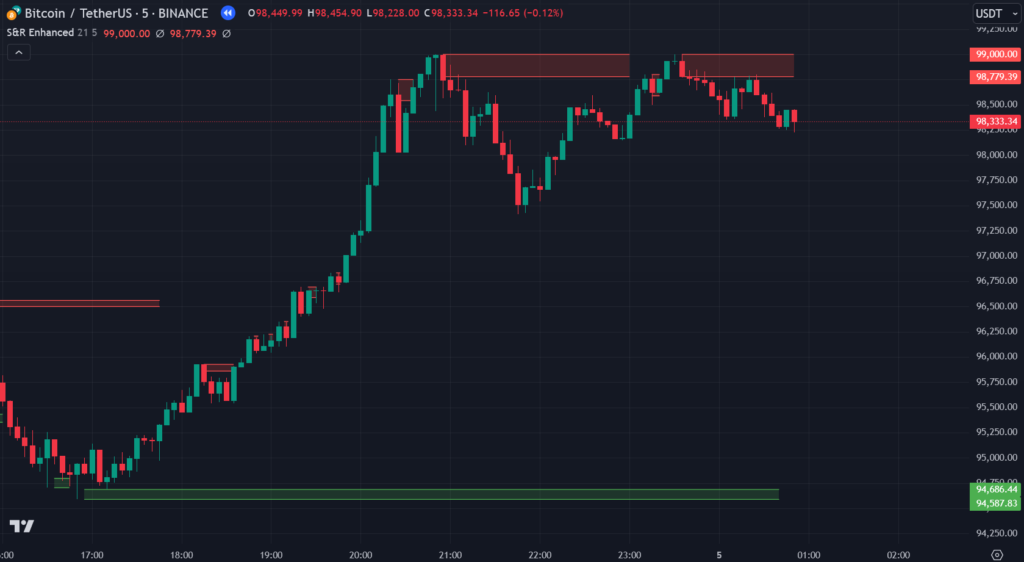
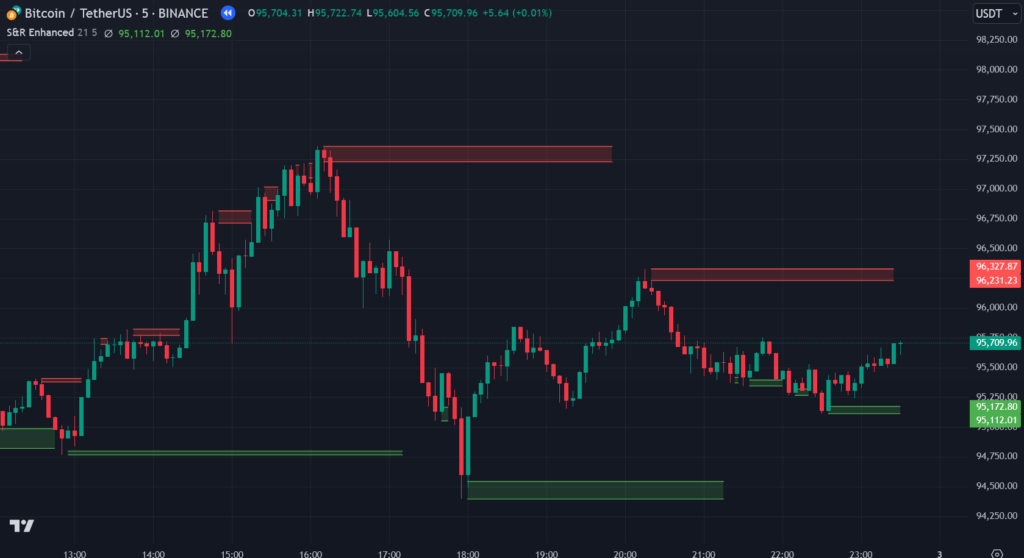
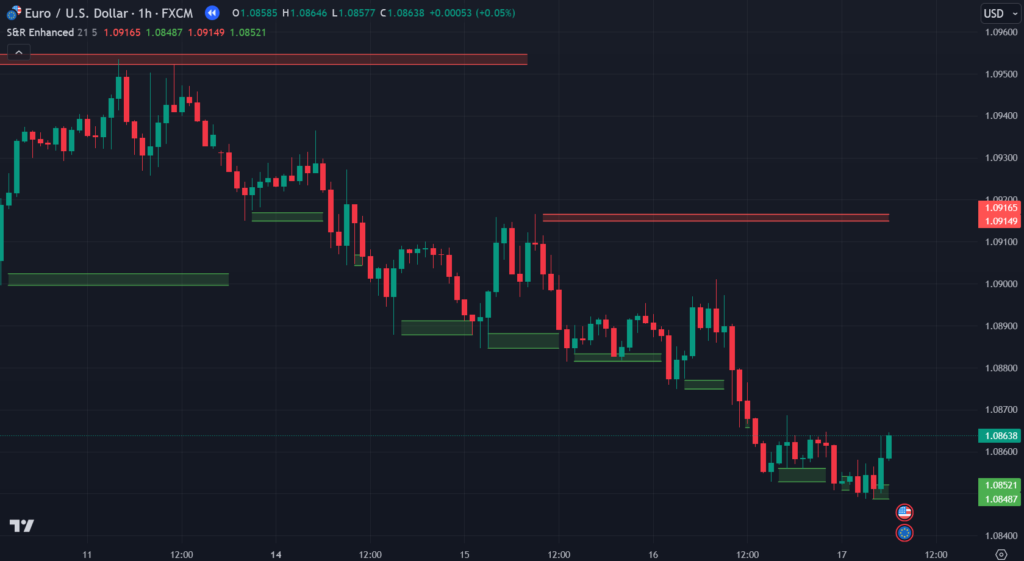
- Support & Resistance Levels: The indicator automatically plots support (green) and resistance (red) lines on the chart, adjusting to the most recent price action. This helps traders identify critical price points for decision-making.
- Trade Zones: The indicator highlights the area between the identified support and resistance levels, providing a visual representation of potential entry and exit zones. This helps traders make more informed decisions about where to enter or exit a trade.
- Customizable Parameters: Traders can customize key parameters of the indicator, including the lookback period and the trade zone percentage. Adjusting the lookback period allows traders to analyze different timeframes for identifying support and resistance levels. The trade zone percentage determines the size of the trade zone, enabling traders to modify the strategy according to their trading style, whether for day trading or long-term strategies.
How Dynamic Support and Resistance levels Indicator Works on TradingView
Using Pine Script, TradingView’s proprietary scripting language, this dynamic support and resistance indicator works seamlessly on the platform. Traders can apply it directly to their charts by simply adding the custom indicator to their TradingView account. Once applied, the indicator will instantly calculate and display support and resistance levels along with the trade zones.
The indicator dynamically updates these levels and zones as the price moves, ensuring that the trader always has access to the most current data. It’s an excellent tool for traders looking for automated solutions to time their entries and exits more precisely. You can adjust the indicator’s parameters to fit your preferred trading style, whether you are a scalper, a day trader, or a swing trader.
Usefulness in Trading
- Trend Reversal: One of the primary advantages of this indicator is its ability to identify potential trend reversals. Support and resistance levels are widely recognized as areas where price is likely to reverse, and this indicator makes it easier for traders to spot those areas in real-time. When price approaches a support or resistance level, it’s often a signal for a potential reversal, giving traders a high-probability entry point.
- Risk Management: Effective risk management is critical to successful trading, and this indicator aids in setting stop-loss and take-profit levels. By accurately identifying key price points, traders can place their stop-loss just below the support level or above the resistance level, depending on the direction of the trade. Similarly, they can set take-profit levels within the trade zones to maximize profits while minimizing risk.
- Trade Planning: The indicator enhances trade planning by helping traders spot high-probability zones where price is likely to react. Knowing these zones in advance helps traders plan their trades more effectively, reducing the likelihood of making impulsive decisions based on market noise. The indicator helps in setting up trades with a clear entry point, stop-loss, and take-profit target, thus streamlining the trading process.
Ideal for Range Trading and Trend Pullbacks
The dynamic Support and Resistance indicator excels in scenarios where the market is ranging or during trend pullbacks. Range trading involves buying near support and selling near resistance, and this indicator simplifies this process by identifying the most relevant support and resistance levels automatically. Traders can use the highlighted trade zones to identify entry points when price is within the support and resistance range.
In addition, the indicator is useful for trading during trend pullbacks. When a trend experiences a retracement, it is often a good opportunity to enter the market in the direction of the prevailing trend. The indicator’s dynamic nature makes it ideal for identifying these pullbacks and providing high-probability zones to trade within.
Conclusion
In summary, this dynamic Support and Resistance indicator for TradingView, developed using Pine Script, offers an innovative solution for traders looking to enhance their technical analysis. By automatically plotting support and resistance levels and identifying trade zones, this tool provides invaluable insights into market behavior. It is particularly useful for trend reversal, risk management, and trade planning, ensuring traders can make more informed decisions. With customizable parameters, it caters to various trading styles and is an essential addition for those who seek to automate and improve their trading strategies.
By incorporating this indicator into your trading toolkit, you can gain a clearer understanding of key price points and increase your chances of making successful trades with reduced risk.
Pinescript of Support & Resistance Enhanced Tradingview Indicator
Reach out to us at +91 7620658346 to access this indicator. We specialize in algo development for TradingView, MT4/MT5, and trading bots.
Follow @algo_aakash on Instagram, YouTube, and Twitter for the latest updates!
Disclaimer
The content in this article and any related indicators is for educational purposes only. Trading in financial markets involves a high level of risk, and there is no guarantee of profits. The custom Bollinger Band strategy relies on historical data and technical analysis, which may not accurately predict future market movements. Users should conduct their own research, evaluate their risk tolerance, and consult with a licensed financial advisor before making any trading decisions. The author and developer of this indicator are not responsible for any losses incurred from using this strategy. Please trade responsibly.
Click here to view this indicator.
🔓 Get This Tool for FREE!
- ✅ Click here to open a trading account using our referral link and start trading.
- 💡 Use coupon code: FREE during checkout.
- 📅 After 7 days of active trading under our referral link, you’ll get access to this tool in your account.
- ⚠️ Keep trading to keep access free — if you're inactive for 7 days, your access will be removed.
- 👉 Already have an account? You can change the IB (introducing broker) to our referral link and still qualify!

0 Comments