🔓 Get All Tools for FREE!
- ✅ Click here to open a trading account using our referral link and start trading.
- 📅 After 7 days of active trading under our referral link, you can get access to all tools in your account.
- ⚠️ Keep trading to keep access free — if you're inactive for 7 days, your access will be removed.
- 👉 Already have an account? You can change the IB (introducing broker) to our referral link ( https://one.exnesstrack.org/a/w7syl3vnjb ) and still qualify!
What is Daily Pivot Point Levels Tradingview Indicator Indicator?
An indicator in the context of trading refers to a tool or set of mathematical formulas that help traders analyze past market data to forecast future price movements. These indicators are essential for traders to make informed decisions about when to buy, sell, or hold a particular asset. On platforms like TradingView, indicators provide crucial insights into market trends, volatility, momentum, and other critical factors that influence asset prices.
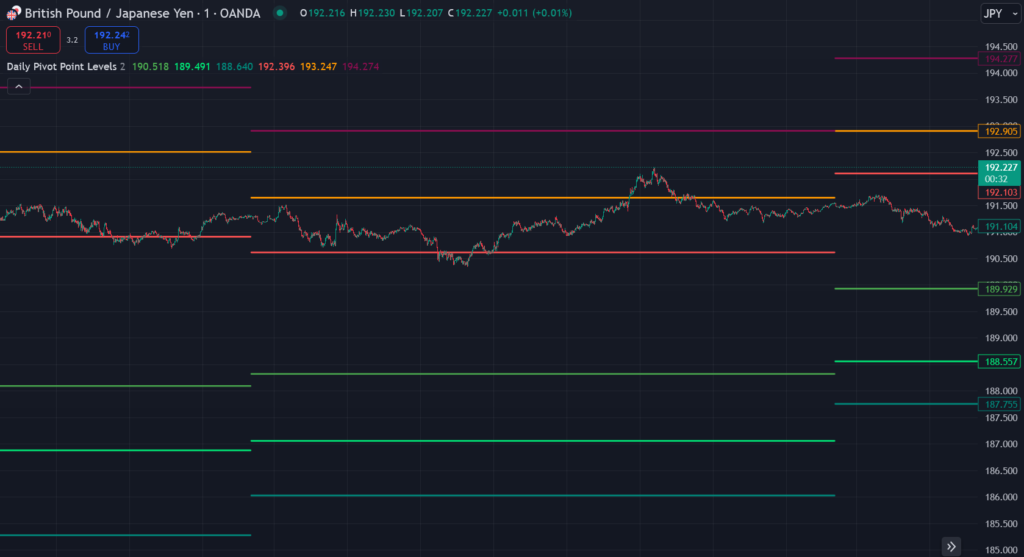
One of the most widely used indicators on TradingView is the Daily Pivot Point Levels Indicator. This tool calculates daily pivot points along with support and resistance levels based on the previous day’s high, low, and close prices. Let’s dive deeper into how this indicator works and how you can use it effectively on TradingView with Pine Script.
Indicator Overview: Daily Pivot Point Levels
The Daily Pivot Point Levels Indicator is an essential tool for traders who rely on technical analysis to make decisions. It computes several key levels:
🔓 Get All Tools for FREE!
- ✅ Click here to open a trading account using our referral link and start trading.
- 📅 After 7 days of active trading under our referral link, you can get access to all tools in your account.
- ⚠️ Keep trading to keep access free — if you're inactive for 7 days, your access will be removed.
- 👉 Already have an account? You can change the IB (introducing broker) to our referral link ( https://one.exnesstrack.org/a/w7syl3vnjb ) and still qualify!
- Pivot Point (P): The primary level, which represents the average of the high, low, and close prices from the previous trading day.
- Support Levels (S1, S2, S3): These levels represent potential support zones where prices may find a floor, reversing the trend or bouncing upwards.
- Resistance Levels (R1, R2, R3): These levels represent potential resistance zones where prices may face upward pressure and reverse or stall.
By calculating these levels automatically each day, the indicator provides traders with a clear understanding of market conditions, helping them make better trading decisions.
Key Features of the Daily Pivot Point Levels Indicator
The Daily Pivot Point Levels Indicator offers several powerful features, making it an invaluable tool for traders on TradingView:
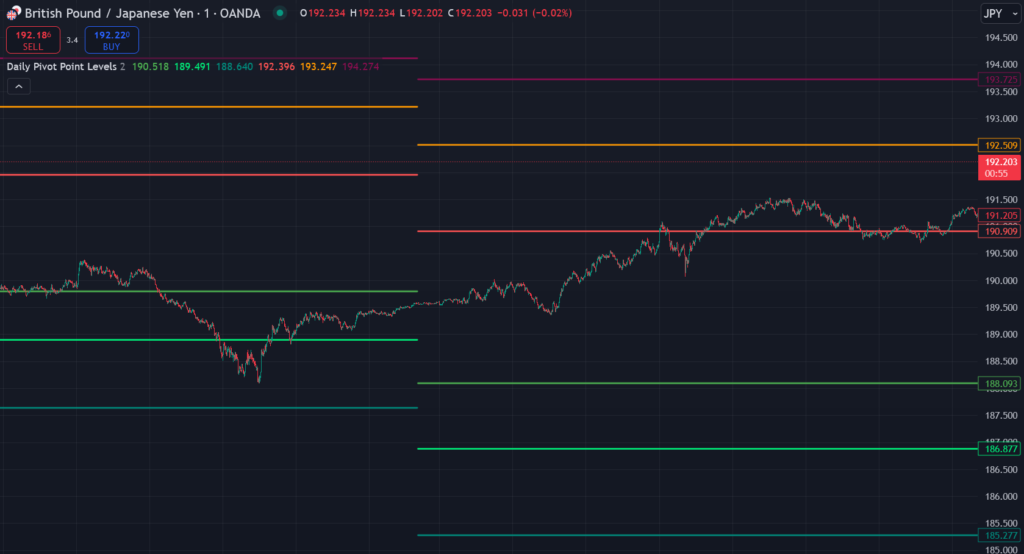
- Dynamic Pivot Levels: The indicator calculates the daily pivot, support, and resistance levels based on the high, low, and close of the previous trading day. These levels adjust automatically as the market opens and continues to update throughout the trading day.
- Customizable Visibility: Traders can choose to toggle individual levels, such as S1, S2, S3, and R1, R2, R3, on or off according to their preference. This flexibility allows traders to streamline their charts and focus on the most relevant levels.
- Adjustable Line Width: For better chart readability, the indicator allows customization of the line width for each level. Traders can adjust the thickness of the pivot, support, and resistance lines to match their personal preferences and enhance their visual experience on TradingView.
How the Daily Pivot Point Levels Indicator Works on TradingView
To use the Daily Pivot Point Levels Indicator on TradingView, you can easily add it to your chart by following these simple steps:
- Login to TradingView: Open your browser and log in to your TradingView account.
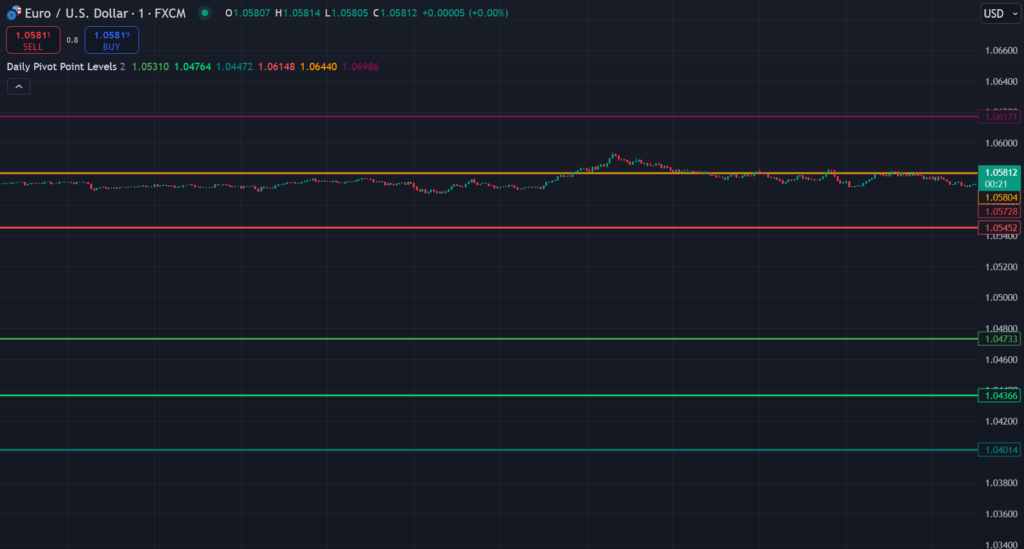
- Select a Chart: Choose the chart for the asset you want to analyze, whether it’s a stock, forex pair, cryptocurrency, or commodity.
- Add the Indicator: Click on the “Indicators” tab at the top of your chart. Search for “Pivot Points Standard” or “Daily Pivot Points” in the search box. Click on the indicator to add it to your chart.
- Customize the Indicator: Once the indicator is applied, click on the settings icon to adjust visibility, line colors, and thickness to match your trading style.
By following these steps, you’ll have the Daily Pivot Point Levels Indicator visible on your chart, showing you the pivot, support, and resistance levels for the day based on the previous trading day’s data.
For traders who prefer more customization, Pine Script, TradingView’s native scripting language, can be used to tweak the indicator further. With Pine Script, you can modify how the indicator calculates levels, change the visual display, or even integrate additional features like alerts when the price reaches specific levels.
Usefulness of the Daily Pivot Point Levels Indicator in Trading
The Daily Pivot Point Levels Indicator is an essential tool for both intraday traders and swing traders. Here’s how it can enhance your trading strategy:
1. Support and Resistance Levels
Support and resistance are critical concepts in technical analysis. The daily pivot point and its associated support and resistance levels give traders a clear idea of where price action might reverse or stall. When the price approaches a support level, there is a higher likelihood of the price bouncing upwards. Conversely, when the price approaches resistance, there may be a reversal or a break above, indicating a potential breakout.
2. Intraday Trading Strategies
For intraday traders, who make quick trades within a single trading session, the pivot points provide clear entry, exit, and stop-loss levels. Since the levels are calculated based on the previous day’s price action, they give traders reliable points of reference for planning trades throughout the day.
- Buying Opportunities: If the price bounces off a support level (e.g., S1 or S2), traders might view it as a potential entry point for a long position.
- Selling Opportunities: If the price approaches a resistance level (e.g., R1 or R2) and starts to reverse, traders may opt to sell or short the asset.
- Stop-Loss: Traders can set their stop-loss orders just below the support levels or just above resistance levels to manage risk.
3. Trend Confirmation
The pivot levels also help confirm trends. For example, if the price is consistently above the pivot point, it may indicate an uptrend, while prices below the pivot suggest a downtrend. If the price is hovering around the pivot point, it may suggest a consolidation phase.
Using the pivot levels in conjunction with other indicators (like moving averages or oscillators) can help validate trend strength or indicate potential trend reversals. This makes the Daily Pivot Point Levels Indicator a powerful tool for confirming trades and improving decision-making.
Conclusion
The Daily Pivot Point Levels Indicator on TradingView is an invaluable tool for traders looking to improve their analysis and trading strategies. With the ability to automatically calculate key levels of support, resistance, and pivot points, this tool helps traders plan better entries, exits, and stop-losses based on solid technical data. Whether you are a day trader or a swing trader, this indicator is a must-have for making data-driven trading decisions.
Additionally, the flexibility of Pine Script allows traders to customize the indicator to suit their specific needs, ensuring that they can adapt the tool to their trading style. By leveraging the power of TradingView and Pine Script, you can take your trading to the next level and enhance your chances of success in the dynamic world of financial markets.
Pinescript of Daily Pivot Point Levels Tradingview Indicator
For access to this indicator, reach out at +91 7620658346. We offer expert algo development for TradingView, MT4/MT5, and trading bots.
Follow @algo_aakash on Instagram, YouTube, and Twitter for the latest updates!
Disclaimer
The information in this article and any related indicators is for educational purposes only. Trading financial markets involves a high level of risk, and there is no guarantee of profit. The custom Bollinger Band strategy is based on historical data and technical analysis, which may not accurately predict future market trends. Users should perform their own research, assess their risk tolerance, and seek advice from a licensed financial advisor before making any trading decisions. The author and developer of this indicator are not responsible for any losses incurred from using this strategy. Please trade responsibly.

0 Comments