🔓 Get All Tools for FREE!
- ✅ Click here to open a trading account using our referral link and start trading.
- 📅 After 7 days of active trading under our referral link, you can get access to all tools in your account.
- ⚠️ Keep trading to keep access free — if you're inactive for 7 days, your access will be removed.
- 👉 Already have an account? You can change the IB (introducing broker) to our referral link ( https://one.exnesstrack.org/a/w7syl3vnjb ) and still qualify!
In the world of trading, identifying candlestick patterns is a crucial skill. These patterns offer valuable insights into market sentiment, potential reversals, and price continuation trends. One of the most powerful tools for traders is the Candlestick Pattern Indicator, which helps detect and label various candlestick formations on your chart. If you’re a trader using TradingView for your analysis, this indicator can significantly enhance your trading strategy. In this article, we’ll explore how this indicator works on TradingView, how it’s powered by Pine Script, and how you can leverage it to improve your market analysis.
What is the Candlestick Pattern Indicator?
The Candlestick Pattern Indicator is a tool that identifies and labels a wide range of candlestick patterns on a price chart. These patterns are important signals in technical analysis, as they can provide insights into the market’s direction and potential trend reversals. On TradingView, this indicator automatically detects the presence of several key candlestick patterns, including:
🔓 Get All Tools for FREE!
- ✅ Click here to open a trading account using our referral link and start trading.
- 📅 After 7 days of active trading under our referral link, you can get access to all tools in your account.
- ⚠️ Keep trading to keep access free — if you're inactive for 7 days, your access will be removed.
- 👉 Already have an account? You can change the IB (introducing broker) to our referral link ( https://one.exnesstrack.org/a/w7syl3vnjb ) and still qualify!
- Doji
- Evening Star
- Morning Star
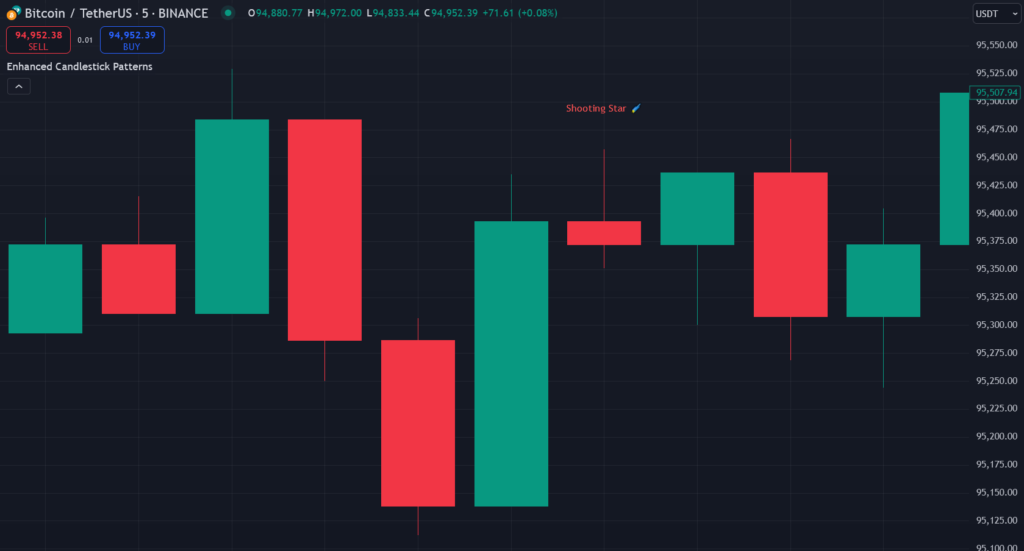
- Shooting Star
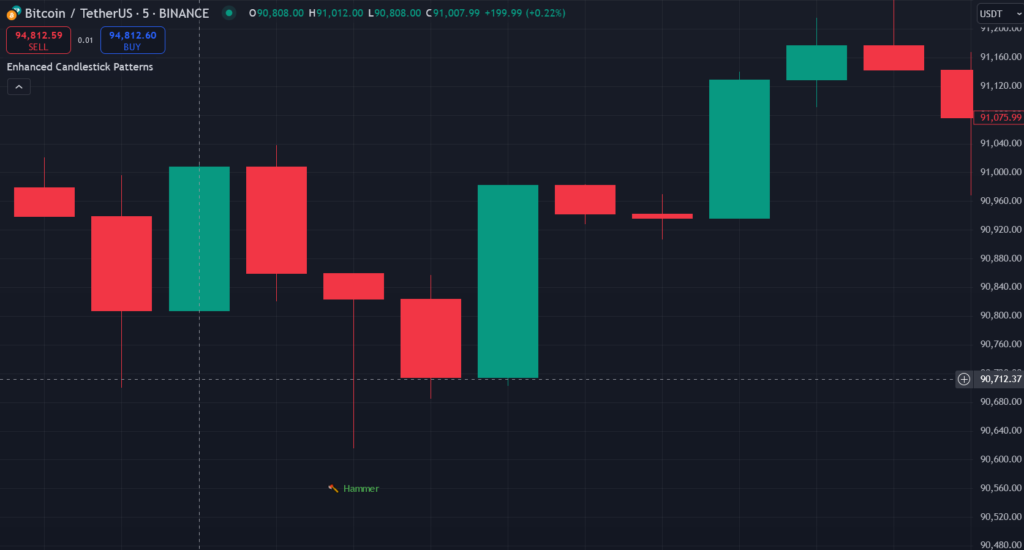
- Hammer
- Inverted Hammer
- Bearish Harami
- Bullish Harami
- Bearish Engulfing
- Bullish Engulfing
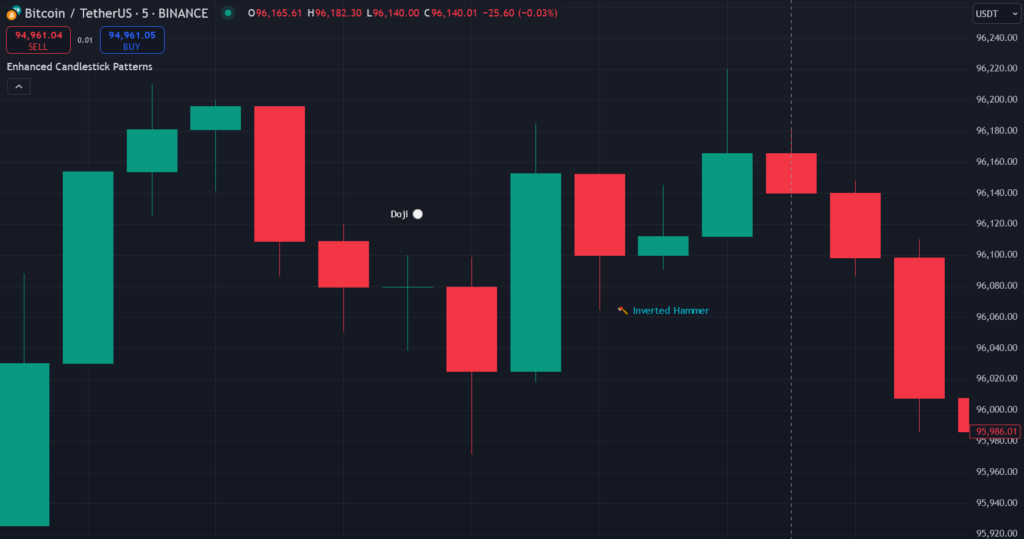
These patterns can signal whether the market is likely to continue in its current direction or reverse. For example, a Doji indicates indecision, while a Bullish Engulfing pattern suggests a potential trend reversal to the upside. The Candlestick Pattern Indicator on TradingView works by identifying these patterns in real-time and displaying them directly on the chart, making it easier for traders to spot key price action signals.
Key Features of the Indicator
The Candlestick Pattern Indicator offers several features that make it particularly useful for traders:
1. Candlestick Pattern Detection
This feature automatically identifies common candlestick patterns based on predefined criteria. As soon as a pattern forms, the indicator detects it and labels it on the chart. This removes the need for traders to manually analyze each candlestick, saving time and reducing the risk of missing critical patterns.
2. Dynamic Labeling
When a candlestick pattern is detected, the indicator labels it with its name and includes a relevant Unicode icon. This makes it easy to visually identify the pattern on the chart. The labels are dynamic, meaning that they will adjust and move to prevent any overlap, even if multiple patterns appear on the same candle.
3. No Overlap
One of the challenges in using candlestick patterns on charts is label overlap when multiple patterns occur at the same time. This indicator uses dynamic spacing to ensure that the labels for each detected pattern don’t overlap, providing clarity even when multiple patterns appear on the same candle.
4. Customizable Labels
The labels for the patterns are color-coded for easy identification. Bullish patterns can be displayed in one color (e.g., green), while bearish patterns might appear in another color (e.g., red). This makes it easier to differentiate between patterns signaling a potential uptrend or downtrend at a glance.
How the Candlestick Pattern Indicator Works on TradingView ?
The Candlestick Pattern Indicator is designed to seamlessly integrate with TradingView‘s charting platform. Here’s how it works:
- Detection of Patterns: The indicator constantly scans the price chart for the occurrence of predefined candlestick patterns. When a pattern is detected, the indicator compares the current candlestick’s open, close, high, and low prices to the characteristics of the various patterns.
- Label Display: Once the pattern is identified, the indicator displays a label at the appropriate position on the chart. The label includes both the name of the pattern (e.g., “Bullish Engulfing”) and an icon that visually represents the pattern.
- Dynamic Spacing: If multiple patterns occur on the same candlestick, the indicator adjusts the placement of the labels to prevent overlap. This ensures that each label remains clear and readable, even when the chart is crowded with multiple signals.
- Customization: You can customize the colors of the labels for both bullish and bearish patterns, making it easier to distinguish between patterns that indicate potential upward or downward price movements.
By using this indicator, traders can quickly spot critical patterns without having to manually identify them, saving time and improving the accuracy of their analysis.
How to Use the Indicator on TradingView
Using the Candlestick Pattern Indicator on TradingView is simple, especially when you use the power of Pine Script, TradingView’s scripting language. Here’s a step-by-step guide to get started:
Step 1: Access the Indicator
To start using the indicator, go to the TradingView platform and open a chart. Then, search for the Candlestick Pattern Indicator in the public library or create your custom version using Pine Script. If you’re comfortable with coding, you can write your own custom script to detect specific patterns.
Step 2: Add the Indicator to Your Chart
Once you’ve selected the indicator, click to add it to your chart. The indicator will automatically begin scanning for candlestick patterns and will display labels for any patterns that it identifies.
Step 3: Analyze the Labels
After the indicator is added, you’ll see the pattern labels on the chart, each indicating the type of candlestick pattern detected. Use the color coding to quickly differentiate between bullish and bearish patterns. The more you use this tool, the quicker you’ll be able to interpret the signals.
Step 4: Customize the Settings
You can customize the indicator’s settings, such as adjusting the label colors or choosing which patterns to display. This makes it easier to tailor the indicator to your trading style.
The Role of Pine Script in the Indicator
At its core, the Candlestick Pattern Indicator on TradingView is powered by Pine Script, TradingView’s proprietary programming language. Pine Script allows traders and developers to create custom indicators, strategies, and alerts for use on the platform. When building the Candlestick Pattern Indicator, Pine Script is used to define the conditions that recognize different candlestick patterns and control how labels are displayed.
With Pine Script, you can even create a custom version of this indicator that suits your unique needs, such as adding alerts when specific patterns form or customizing the colors and labels for better clarity.
Conclusion
The Candlestick Pattern Indicator on TradingView is an invaluable tool for any trader, offering a straightforward and automated way to spot key candlestick patterns in real-time. By using Pine Script, traders can customize and extend the indicator to suit their specific needs, making it a versatile addition to any technical analysis toolkit. Whether you’re a beginner or an experienced trader, this indicator can enhance your ability to identify trends, reversals, and market sentiment, leading to more informed and timely trading decisions.
Pinescript of Candlestick Pattern Indicator on TradingView
Reach us at +91 7620658346 to get access to this indicator. We offer expert algo development for TradingView indicators, MT4/MT5, and trading bots.
Follow @algo_aakash on Instagram, YouTube, and Twitter for more updates!
Disclaimer
The information provided in this article and any related indicators is for educational purposes only. Trading in financial markets involves significant risk, and there is no guarantee of profit. The custom Bollinger Band strategy is based on historical data and technical analysis, which may not reflect future market behavior. Users should conduct their own research, assess their risk tolerance, and seek advice from a licensed financial advisor before making any trading decisions. The author and developer of this indicator are not responsible for any losses incurred through the use of this strategy. Please trade responsibly.

0 Comments