🔓 Get All Tools for FREE!
- ✅ Click here to open a trading account using our referral link and start trading.
- 📅 After 7 days of active trading under our referral link, you can get access to all tools in your account.
- ⚠️ Keep trading to keep access free — if you're inactive for 7 days, your access will be removed.
- 👉 Already have an account? You can change the IB (introducing broker) to our referral link ( https://one.exnesstrack.org/a/w7syl3vnjb ) and still qualify!
In the world of technical analysis, having the right tools can significantly enhance a trader’s ability to make informed decisions. One such tool is the “Bollinger Bands with Fibonacci” indicator, which combines the traditional Bollinger Bands with Fibonacci retracement levels to provide more dynamic and reliable price analysis. This article will explain how the indicator works and how you can use it effectively on TradingView.
What is the Bollinger Bands with Fibonacci Indicator?
The “Bollinger Bands with Fibonacci” indicator is a combination of two popular technical analysis tools: Bollinger Bands and Fibonacci retracement levels. Bollinger Bands are typically used to measure price volatility, while Fibonacci levels are applied to identify potential support and resistance zones. By integrating both concepts, this indicator offers a more refined approach to understanding price movements and predicting market trends.
🔓 Get All Tools for FREE!
- ✅ Click here to open a trading account using our referral link and start trading.
- 📅 After 7 days of active trading under our referral link, you can get access to all tools in your account.
- ⚠️ Keep trading to keep access free — if you're inactive for 7 days, your access will be removed.
- 👉 Already have an account? You can change the IB (introducing broker) to our referral link ( https://one.exnesstrack.org/a/w7syl3vnjb ) and still qualify!
1. VWMA (Volume Weighted Moving Average):
At the core of this indicator is the Volume Weighted Moving Average (VWMA). The VWMA is a type of moving average that gives more weight to price data from candles with higher trading volumes. This makes the VWMA more responsive to price movements that occur with greater volume, providing a better indication of the strength or weakness of a trend.
2. Standard Deviation (Stdev):
Bollinger Bands rely on standard deviation, which measures how much the price deviates from the average price. In the case of the “Bollinger Bands with Fibonacci” indicator, the standard deviation is scaled by a multiplier to determine the width of the Bollinger Bands. A larger standard deviation indicates higher price volatility, and the bands expand accordingly. In contrast, when volatility is low, the bands contract.
3. Fibonacci Levels:
Fibonacci retracement levels are key tools used by traders to identify potential reversal points in the market. In this indicator, Fibonacci ratios (such as 0.236, 0.382, 0.5, 0.618, 0.764, and 1) are applied to the standard deviation of the price, resulting in upper and lower bands at various Fibonacci levels. These levels are considered important for identifying support and resistance zones. By adding Fibonacci to Bollinger Bands, the indicator highlights areas where price action may reverse or consolidate.
4. Plotting and Visualization:
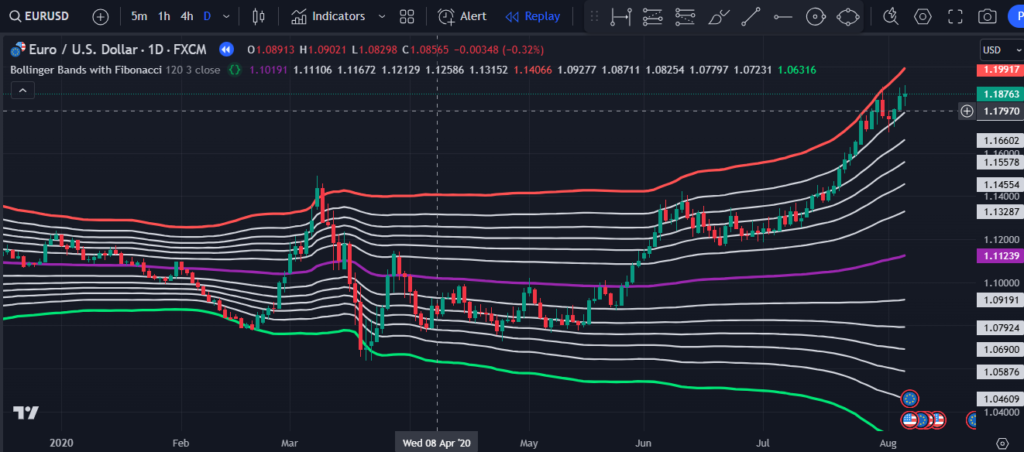
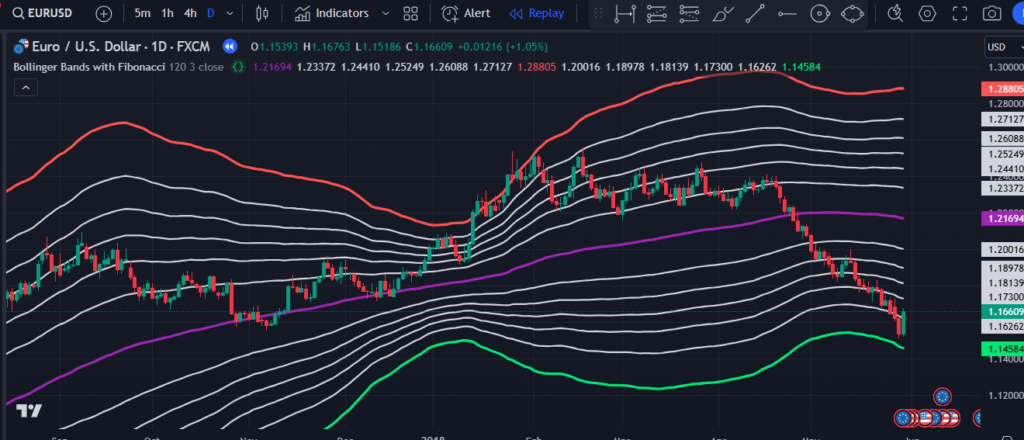
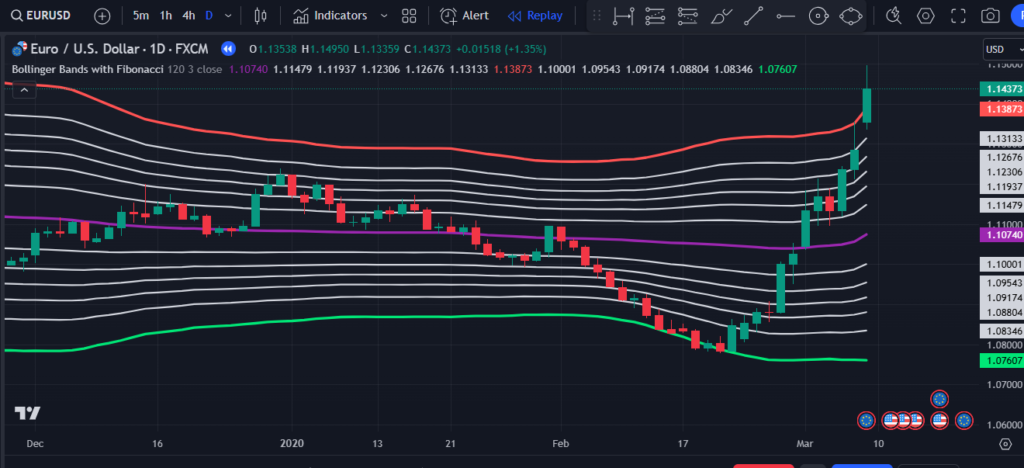
On the chart, the indicator displays several key components:
- Middle Line (VWMA): The VWMA line, often plotted in purple, acts as the central line and reflects the weighted average price.
- Upper and Lower Fibonacci Bands: The upper Fibonacci bands are plotted in various colors, with the highest level (1) in red, while the lower bands are plotted in green or lime. These bands represent potential resistance and support levels at different Fibonacci retracement levels.
How the Bollinger Bands with Fibonacci Indicator Works on TradingView
Using the “Bollinger Bands with Fibonacci” indicator on TradingView is straightforward and can add significant value to your trading strategy. Here’s how it works:
1. Applying the Indicator:
To apply this indicator on TradingView, simply search for the “Bollinger Bands with Fibonacci” script in the indicator section. You can either use a pre-built script or create your own using Pine Script.
2. Adjusting the Parameters:
- Length: This parameter controls how many bars the VWMA and standard deviation calculations are based on. A higher length will smooth out the indicator, while a lower length will make it more responsive to recent price movements.
- Multiplier: The multiplier determines the width of the Bollinger Bands. Increasing the multiplier will make the bands wider, while decreasing it will make the bands narrower.
3. Reading the Bands:
- The middle VWMA line is the key reference point for identifying price trends.
- Upper Fibonacci Bands: These bands represent potential resistance levels. When the price approaches these levels, traders often watch for signs of price reversal or breakout.
- Lower Fibonacci Bands: These bands represent potential support levels. If the price approaches these bands, it may indicate a potential buying opportunity if the price is expected to bounce higher.
4. Market Conditions:
- During periods of high volatility, the Bollinger Bands will expand, and traders can look for breakout opportunities as the price moves past key Fibonacci levels.
- During periods of low volatility, the bands will contract, signaling consolidation. Traders often use these periods to wait for a breakout or reversal.
Conclusion
The “Bollinger Bands with Fibonacci” indicator is a powerful tool for traders who want to incorporate both price volatility and key support/resistance levels into their analysis. By combining the responsiveness of the VWMA with the accuracy of Fibonacci levels, this indicator offers a comprehensive view of potential price reversals, breakouts, and consolidation zones. Using this indicator on TradingView provides valuable insights, helping traders make more informed decisions in both trending and range-bound markets. Whether you’re a beginner or an experienced trader, this tool can enhance your ability to predict price movements and manage risk effectively.
Pinescript of Bollinger Bands with Fibonacci TradingView Indicator :
Contact us at +91 7620658346 to unlock this premium indicator! We specialize in creating custom TradingView indicators, MT4/MT5 strategies, and trading bots.
Stay connected for updates and trading insights on Instagram, YouTube, and Twitter: @algo_aakash!
Disclaimer
The information provided in this article and any related indicators is for educational purposes only. Trading financial markets involves substantial risk, and profits are not guaranteed. The custom Bollinger Band strategy is based on historical data and technical analysis, which may not predict future market behavior. Users should conduct their own research, assess their risk tolerance, and consult with a licensed financial advisor before making any trading decisions. The author and developer of this indicator are not liable for any losses incurred through the use of this strategy. Please trade responsibly.
0 Comments