🔓 Get All Tools for FREE!
- ✅ Click here to open a trading account using our referral link and start trading.
- 📅 After 7 days of active trading under our referral link, you can get access to all tools in your account.
- ⚠️ Keep trading to keep access free — if you're inactive for 7 days, your access will be removed.
- 👉 Already have an account? You can change the IB (introducing broker) to our referral link ( https://one.exnesstrack.org/a/w7syl3vnjb ) and still qualify!
When it comes to trading, success often hinges on the ability to spot trends, identify potential reversals, and manage risk effectively. One such tool that can help you accomplish these goals is the BB & RSI Strategy indicator. This powerful combination leverages Bollinger Bands (BB), the Relative Strength Index (RSI), and a comprehensive risk management system to enhance your trading decisions. In this article, we’ll delve into how this indicator works, how to use it on TradingView with PineScript, and how it can elevate your trading strategies.
What Is the BB & RSI Strategy Indicator?
The BB & RSI Strategy indicator is a sophisticated trading tool that combines three essential elements:
🔓 Get All Tools for FREE!
- ✅ Click here to open a trading account using our referral link and start trading.
- 📅 After 7 days of active trading under our referral link, you can get access to all tools in your account.
- ⚠️ Keep trading to keep access free — if you're inactive for 7 days, your access will be removed.
- 👉 Already have an account? You can change the IB (introducing broker) to our referral link ( https://one.exnesstrack.org/a/w7syl3vnjb ) and still qualify!
- Bollinger Bands (BB): These bands are used to measure price volatility by creating upper and lower bands around a moving average (typically an SMA). The distance between the bands adjusts based on market volatility, making it easier to identify price breakouts or periods of consolidation.
- Relative Strength Index (RSI): RSI is a momentum oscillator that measures the speed and change of price movements. It helps traders detect overbought and oversold levels, signaling potential reversal points in the market.
- Risk Management: With built-in stop-loss (SL) and risk-reward (RR) management features, this indicator offers automatic trade management, making it easier for traders to adhere to disciplined risk strategies.
Together, these three elements work synergistically to provide high-probability trade setups, with clear buy and sell signals based on the interaction of the BB and RSI.
How Does the BB & RSI Strategy Work?
Understanding how each component works individually is key to fully grasping the BB & RSI Strategy indicator.
- Bollinger Bands (BB):
- Upper Band: The upper Bollinger Band indicates the maximum price point over a certain period, adjusted for volatility.
- Lower Band: The lower Bollinger Band represents the minimum price point over the same period.
- SMA (Simple Moving Average): The middle line, typically a 20-period SMA, serves as a reference point for the upper and lower bands.
When the price breaks above the upper band, it suggests an overbought market, indicating a potential reversal or continuation in an uptrend. Conversely, when the price breaks below the lower band, it suggests an oversold market, often signaling the possibility of a price rebound or trend reversal.
- Relative Strength Index (RSI):
- The RSI oscillator ranges from 0 to 100 and helps traders assess the momentum of a price movement.
- Overbought Zone: RSI values above 70 indicate that an asset may be overbought and could experience a pullback.
- Oversold Zone: RSI values below 30 suggest that an asset is oversold and may reverse upward.
By combining RSI with the Bollinger Bands, the BB & RSI Strategy indicator helps identify precise entry and exit points. For example, if the price breaks the lower Bollinger Band and the RSI shows oversold conditions, it could indicate a buying opportunity, while a price breach above the upper Bollinger Band along with an overbought RSI might signal a selling opportunity.
- Stop-Loss (SL) and Risk-Reward (RR):
- Stop-Loss (SL): The indicator automatically sets a stop-loss at recent swing highs for sell trades and swing lows for buy trades, helping traders manage risk and protect against large losses.
- Risk-Reward (RR): The indicator follows a 1:2 risk-reward ratio. This means that for every unit of risk, the indicator targets twice that amount in potential profit, ensuring that traders maintain a balanced and disciplined approach to their trades.
This combination of risk management tools ensures that each trade has a clear exit strategy, whether it’s for profit or loss, minimizing the emotional aspect of trading.
How to Use the BB & RSI Strategy Indicator on TradingView
TradingView is a popular charting platform that allows traders to access a variety of indicators, including custom ones like the BB & RSI Strategy. Using PineScript, TradingView’s scripting language, you can create or modify your own indicators to fit your specific trading style.
Here’s how to use the BB & RSI Strategy indicator on TradingView:
- Adding the Indicator:
- Open your TradingView chart.
- In the top panel, click on Indicators.
- Search for BB & RSI Strategy or enter the PineScript code if you have a custom script.
- Select the indicator, and it will automatically overlay on your chart, displaying the Bollinger Bands and RSI with the built-in risk management tools.
- Customizing the Settings:
- Bollinger Bands: You can adjust the period and standard deviation settings of the Bollinger Bands to suit your trading style. A common setting is a 20-period SMA with a 2 standard deviation, but you can experiment to find what works best for your strategy.
- RSI: The RSI settings can also be customized, adjusting the period to match your preferred time frame or market conditions.
- Risk Management: The automatic stop-loss and take-profit levels can be fine-tuned according to your risk tolerance.
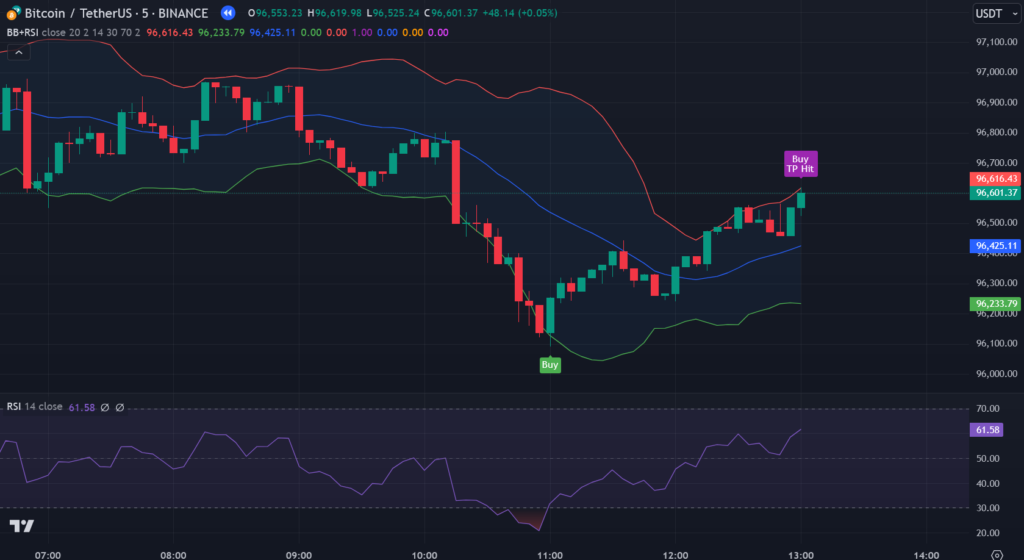
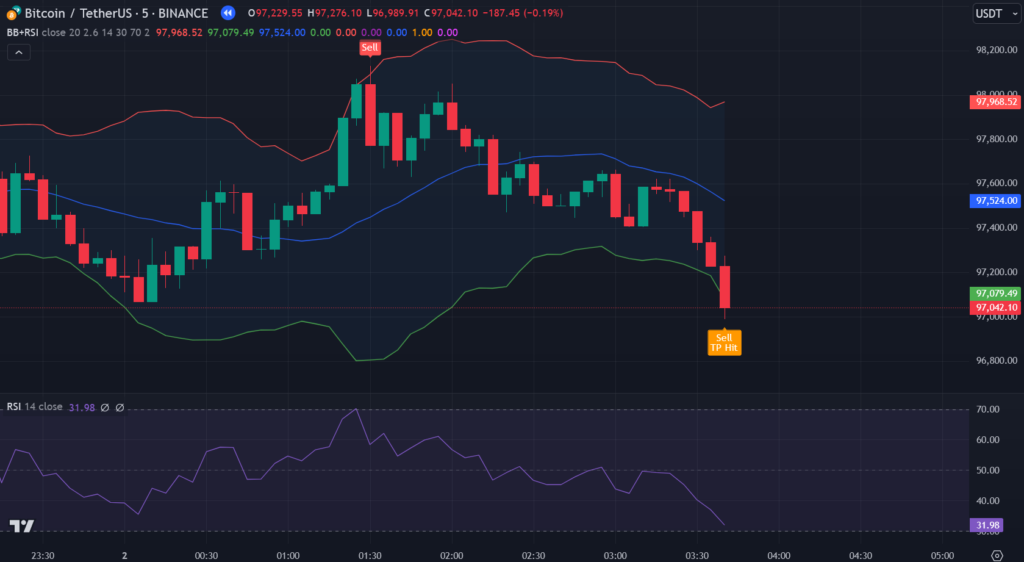
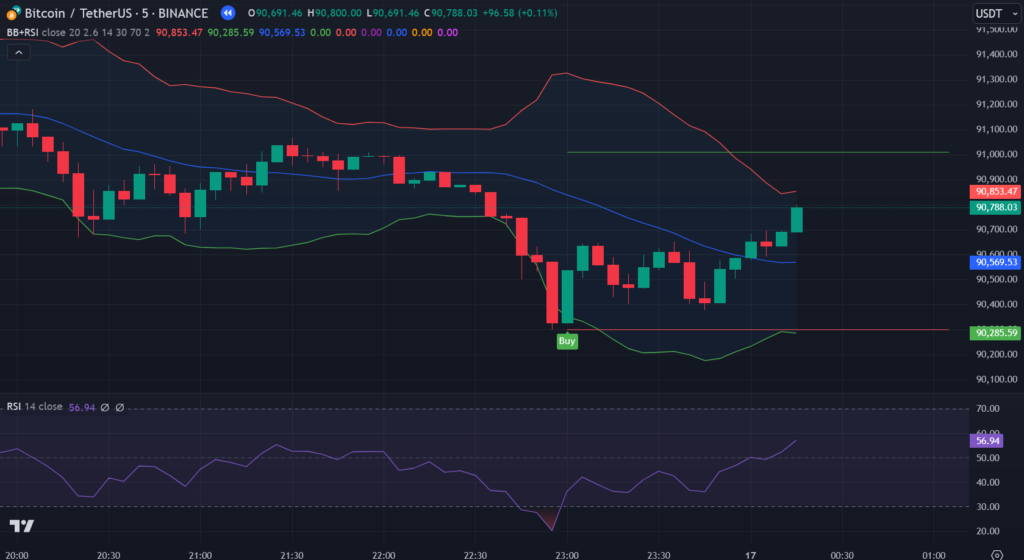
- Interpreting Buy/Sell Signals:
- Buy Signal: When the price breaks the lower Bollinger Band and the RSI is below 30 (oversold), the indicator will trigger a buy signal.
- Sell Signal: When the price breaks above the upper Bollinger Band and the RSI is above 70 (overbought), a sell signal will be generated.
- Stop-Loss and Take-Profit: The indicator will automatically set stop-loss levels based on recent swing highs or lows, along with a target price that aligns with your risk-reward ratio.
Why the BB & RSI Strategy is Useful in Trading
The BB & RSI Strategy indicator offers several advantages for traders:
- High-Probability Entries and Exits: By combining Bollinger Bands and RSI, the indicator helps pinpoint potential trend reversals and breakout points, providing high-confidence trade signals.
- Disciplined Risk Management: The built-in stop-loss and risk-reward features help traders manage risk effectively, avoiding emotional decision-making during trade execution.
- Versatility: Whether you’re a trend-following trader or someone who prefers reversal strategies, the BB & RSI Strategy adapts to various market conditions, making it suitable for different trading styles.
- Customizable for Different Trading Styles: With the ability to tweak settings for both BB and RSI, traders can tailor the indicator to their specific market conditions and preferences, whether for scalping, day trading, or swing trading.
Conclusion
The BB & RSI Strategy indicator is a powerful tool for traders looking to combine volatility analysis, momentum signals, and disciplined risk management. By utilizing Bollinger Bands, RSI, and automatic stop-loss and risk-reward settings, traders can enhance their ability to identify profitable trade opportunities. Whether you’re a novice trader or an experienced one, this indicator on TradingView, using PineScript, can significantly improve your trading strategies and risk management practices.
If you’re ready to take your trading to the next level, incorporating the BB & RSI Strategy into your TradingView charts could be a game-changer. Happy trading!
Pinescript of BB & RSI Strategy TradingView Indicator
Contact us at +91 7620658346 to get this indicator. We provide professional algo development for TradingView, MT4/MT5, and trading bots.
Stay connected—follow @algo_aakash on Instagram, YouTube, and Twitter!
Disclaimer
The content in this article and any related indicators is for educational purposes only. Trading financial markets involves significant risk, and there is no guarantee of profit. The custom Bollinger Band strategy is based on historical data and technical analysis, which may not reliably predict future market trends. Users are encouraged to conduct their own research, assess their risk tolerance, and consult with a licensed financial advisor before making any trading decisions. The author and developer of this indicator are not responsible for any losses incurred from using this strategy. Please trade responsibly.
🔓 Get This Tool for FREE!
- ✅ Click here to open a trading account using our referral link and start trading.
- 💡 Use coupon code: FREE during checkout.
- 📅 After 7 days of active trading under our referral link, you’ll get access to this tool in your account.
- ⚠️ Keep trading to keep access free — if you're inactive for 7 days, your access will be removed.
- 👉 Already have an account? You can change the IB (introducing broker) to our referral link and still qualify!

0 Comments