🔓 Get All Tools for FREE!
- ✅ Click here to open a trading account using our referral link and start trading.
- 📅 After 7 days of active trading under our referral link, you can get access to all tools in your account.
- ⚠️ Keep trading to keep access free — if you're inactive for 7 days, your access will be removed.
- 👉 Already have an account? You can change the IB (introducing broker) to our referral link ( https://one.exnesstrack.org/a/w7syl3vnjb ) and still qualify!
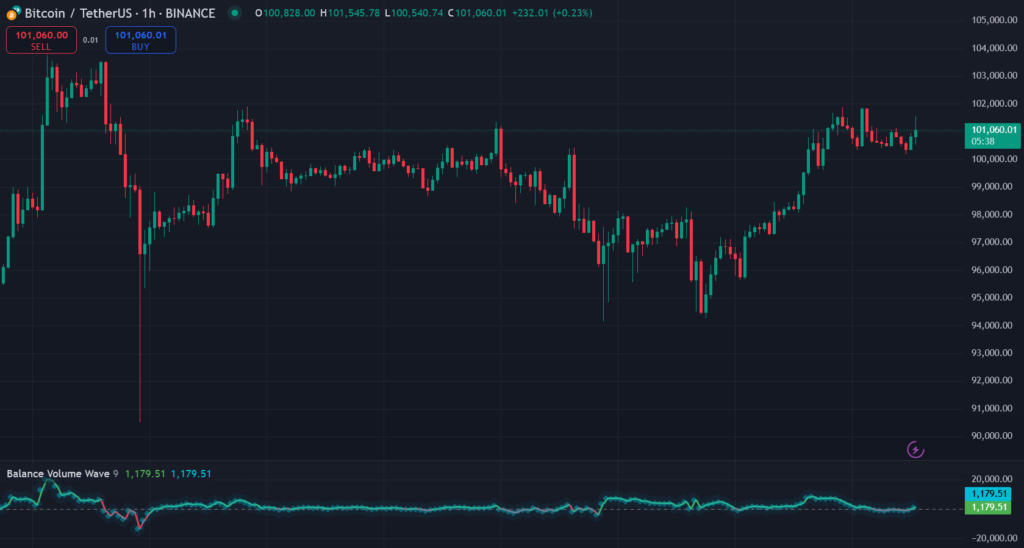
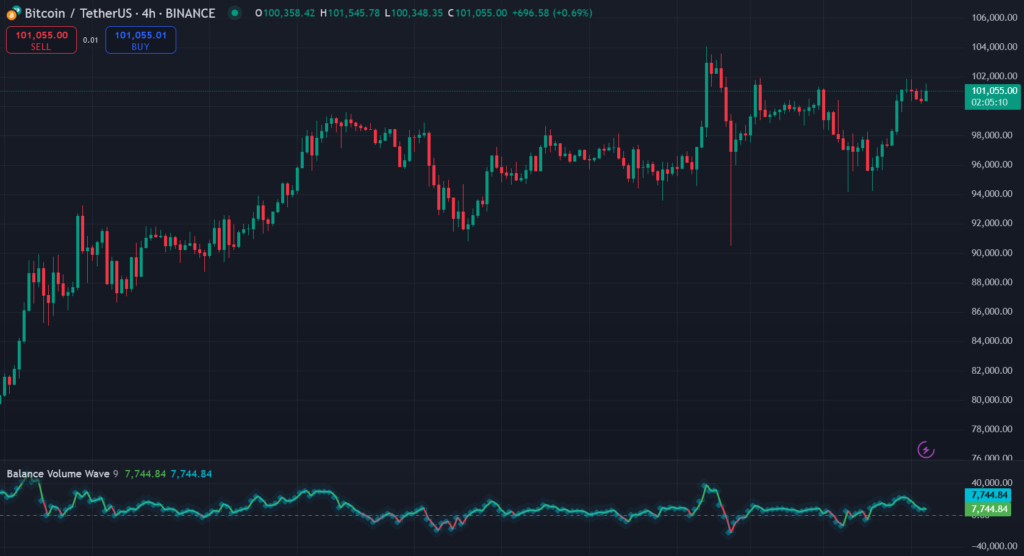
In the world of trading, accurate analysis of market volume and price action is essential to making informed decisions. One such tool that has gained attention among traders is the Balance Volume Wave indicator, a more advanced version of the traditional On-Balance Volume (OBV) indicator. This TradingView-based indicator leverages volume trends to help identify buying and selling pressure, improving the accuracy of trend predictions. Let’s dive deeper into how this indicator works and how you can use it effectively in your trading strategy.
What is the Balance Volume Wave Indicator?
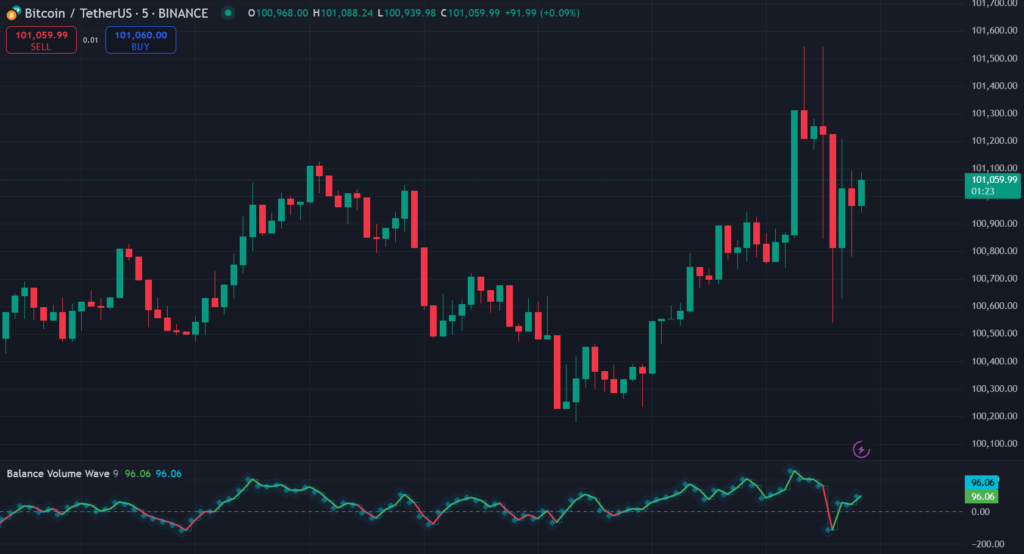
The Balance Volume Wave is a trading tool derived from the well-known On-Balance Volume (OBV) concept. The OBV indicator, created by Joseph Granville, is designed to show the relationship between volume and price changes, offering insights into whether a market is driven by buying or selling pressure. The Balance Volume Wave enhances this by incorporating an oscillator to smooth the OBV data, providing clearer signals and reducing market noise.
🔓 Get All Tools for FREE!
- ✅ Click here to open a trading account using our referral link and start trading.
- 📅 After 7 days of active trading under our referral link, you can get access to all tools in your account.
- ⚠️ Keep trading to keep access free — if you're inactive for 7 days, your access will be removed.
- 👉 Already have an account? You can change the IB (introducing broker) to our referral link ( https://one.exnesstrack.org/a/w7syl3vnjb ) and still qualify!
How Does the Balance Volume WavebIndicator Work on Tradingview?
1. On-Balance Volume (OBV) Calculation
The OBV measures the flow of volume based on price movements:
- Positive Volume: When the price closes higher than the previous candle, the volume is added.
- Negative Volume: When the price closes lower than the previous candle, the volume is subtracted.
- Zero Volume: When the price remains the same, the volume is ignored.
The formula for OBV is:
OBV = Previous OBV + Current Candle Volume (based on price movement direction)
2. Oscillator Calculation
The Balance Volume Wave builds on the OBV by applying an Exponential Moving Average (EMA) to smooth the data:
OBV Oscillator = OBV – EMA(OBV, Period)
The EMA helps eliminate minor price fluctuations and reveals the broader market trend, enhancing the clarity of the volume trend.
3. Oscillator Visualization
The OBV Oscillator is represented visually on your TradingView chart as a line. Here’s how to interpret it:
- Green Line: Indicates that the OBV Oscillator is positive, showing bullish volume pressure.
- Red Line: Indicates a negative OBV Oscillator, reflecting bearish volume pressure.
- An aqua-colored area plot is used to highlight the fluctuations of the oscillator, making it easier to visualize volume trends.
4. Zero Line Reference
A dashed horizontal line at zero acts as a reference for interpreting volume shifts:
- Above Zero: When the oscillator crosses above zero, it signals an increase in buying pressure (bullish signal).
- Below Zero: When the oscillator crosses below zero, it signals an increase in selling pressure (bearish signal).
Features of the Balance Volume Wave Indicator
This indicator has several key features that make it highly effective for traders:
- Customizable EMA Period: You can adjust the smoothing period (EMA period) to fit your trading strategy. A shorter period will make the oscillator more sensitive, while a longer period will smooth out short-term fluctuations.
- Color-Coded Oscillator: The positive and negative values are color-coded (green and red, respectively), making it easier to interpret the trend direction at a glance.
- Visual Enhancements: The step-line and area plot (in aqua) provide additional clarity, making it easier to track volume trends and interpret the data.
- Real-Time Updates: The Balance Volume Wave indicator dynamically updates with each new candle, ensuring that you have the most up-to-date information about market volume and trends.
How This Indicator is Useful in Trading
The Balance Volume Wave indicator offers several benefits to traders, helping them make more informed decisions:
1. Identifying Volume-Driven Trends
The OBV Oscillator allows traders to identify whether buying or selling pressure dominates in the market, confirming price movements supported by volume. This helps avoid false breakouts and confirms the strength of a trend.
2. Bullish and Bearish Divergence Detection
Traders can also use the Balance Volume Wave to spot divergences between price action and volume trends:
- Bullish Divergence: If the price forms lower lows but the oscillator forms higher lows, it may indicate an impending bullish reversal.
- Bearish Divergence: If the price forms higher highs while the oscillator forms lower highs, it may signal a potential bearish reversal.
3. Trend Confirmation
The Balance Volume Wave indicator can serve as a confirmation tool for trend direction:
- Bullish Confirmation: When the oscillator crosses above zero, it indicates bullish momentum, supporting long entry signals.
- Bearish Confirmation: When the oscillator crosses below zero, it suggests bearish momentum, validating short positions.
4. Volume Strength Assessment
By combining volume data with price action, this indicator provides valuable insights into the strength of ongoing trends, helping traders assess whether a trend is likely to continue or if it is weakening.
5. Versatility Across Markets
The Balance Volume Wave works across various markets (stocks, forex, crypto) and timeframes, making it an essential tool for different trading styles. Whether you’re a short-term scalper or a long-term swing trader, you can customize the indicator’s settings to suit your needs.
Practical Use Cases for the Balance Volume Wave Indicator
Here are a few practical ways you can use the Balance Volume Wave indicator in your trading:
1. Entry Points
- Go Long: Enter a long position when the oscillator turns green and crosses above zero, signaling increased buying pressure.
- Go Short: Enter a short position when the oscillator turns red and crosses below zero, signaling an increase in selling pressure.
2. Exit Signals
- Exit a Trade: Consider exiting a position when the oscillator shifts direction, indicating a loss of volume momentum or a potential trend reversal.
3. Confirmation Tool
- Combine the Balance Volume Wave with other indicators like moving averages or the RSI to confirm trend direction before entering trades, reducing the risk of false signals.
4. Scalping or Swing Trading
- For scalping, use shorter EMA periods to receive quicker signals, while for swing trading, use longer EMA periods to filter out noise and capture more stable trends.
Conclusion
The Balance Volume Wave indicator is an advanced tool that helps traders analyze volume trends more effectively. By combining the OBV concept with an oscillator, it offers a clearer view of buying and selling pressure, allowing traders to identify trend reversals, confirm market momentum, and assess volume strength. Whether you’re trading stocks, forex, or crypto, this versatile tool can enhance your trading strategy on TradingView, providing actionable insights based on volume trends.
By utilizing PineScript in TradingView, this indicator offers a dynamic and customizable way to track volume-driven price movements and improve your market analysis. Implementing this tool into your trading routine will give you a significant edge in understanding and reacting to the markets more effectively.
Pinesceript of Balance Volume Wave TradingView Indicator
Reach out to us at +91 7620658346 for access to this indicator. We specialize in custom algorithm development for TradingView, MT4/MT5, and trading bots.
Follow @algo_aakash on Instagram, YouTube, and Twitter for the latest updates.
Disclaimer
The information in this article and any associated indicators is for educational purposes only. Trading financial markets involves substantial risk, and there is no assurance of profits. The custom Bollinger Band strategy is based on historical data and technical analysis, which may not necessarily reflect future market performance. Users are advised to conduct their own research, assess their risk tolerance, and consult with a licensed financial advisor before making any trading decisions. The author and developer of this indicator are not liable for any losses resulting from the use of this strategy. Please trade responsibly.
Access this indicator by clicking here.
🔓 Get This Tool for FREE!
- ✅ Click here to open a trading account using our referral link and start trading.
- 💡 Use coupon code: FREE during checkout.
- 📅 After 7 days of active trading under our referral link, you’ll get access to this tool in your account.
- ⚠️ Keep trading to keep access free — if you're inactive for 7 days, your access will be removed.
- 👉 Already have an account? You can change the IB (introducing broker) to our referral link and still qualify!

0 Comments