🔓 Get All Tools for FREE!
- ✅ Click here to open a trading account using our referral link and start trading.
- 📅 After 7 days of active trading under our referral link, you can get access to all tools in your account.
- ⚠️ Keep trading to keep access free — if you're inactive for 7 days, your access will be removed.
- 👉 Already have an account? You can change the IB (introducing broker) to our referral link ( https://one.exnesstrack.org/a/w7syl3vnjb ) and still qualify!
TradingView is a popular platform among traders and investors for its advanced charting tools, customizable indicators, and powerful scripting capabilities. One of the most widely used technical indicators on TradingView is the Relative Strength Index (RSI), which helps traders assess whether a security is overbought or oversold, potentially signaling trend reversals. However, the default RSI may lack some visual enhancements that make trend analysis more intuitive. This is where the Custom RSI Alert Strategy indicator shines, providing a dynamic and visually engaging way to interpret RSI data.
In this article, we’ll explore what the Custom RSI Alert Strategy indicator is, how it works on TradingView, and how it can help enhance your trading strategies using Pine Script.
🔓 Get All Tools for FREE!
- ✅ Click here to open a trading account using our referral link and start trading.
- 📅 After 7 days of active trading under our referral link, you can get access to all tools in your account.
- ⚠️ Keep trading to keep access free — if you're inactive for 7 days, your access will be removed.
- 👉 Already have an account? You can change the IB (introducing broker) to our referral link ( https://one.exnesstrack.org/a/w7syl3vnjb ) and still qualify!
What is the Custom RSI Alert Strategy Indicator?
The Custom RSI Alert Strategy indicator is a customized version of the standard RSI, designed to provide more visual clarity and trading signals. The RSI, by default, ranges from 0 to 100 and is typically plotted as a single line. This new strategy, however, takes the RSI’s functionality a step further by using dynamic color changes and an area plot to represent the RSI values. This makes it much easier to identify potential trading opportunities based on RSI behavior, such as overbought or oversold conditions, trend shifts, and reversals.
Indicator Overview
The Custom RSI Alert Strategy indicator works by plotting the RSI as an area plot on the chart with dynamic color changes. Here’s a breakdown of how the indicator works and its key components:
RSI Calculation
The RSI is calculated using the standard formula: RSI=100−(1001+Average GainAverage Loss)RSI = 100 – \left( \frac{100}{1 + \frac{\text{Average Gain}}{\text{Average Loss}}} \right)
This formula calculates the relative strength of a price movement, oscillating between 0 and 100. The indicator is then scaled for better visualization.
Levels
The indicator features key horizontal lines at:
- 0 (silver): Represents the baseline of the RSI.
- Lower level (-30, green): This level is used to mark an oversold condition or a potential bullish reversal.
- Higher level (30, red): This level marks an overbought condition or a potential bearish reversal.
These levels provide a visual reference for traders to gauge the strength of the current trend.
Bar Coloring
One of the most distinctive features of this indicator is its dynamic bar coloring based on the value of the RSI:
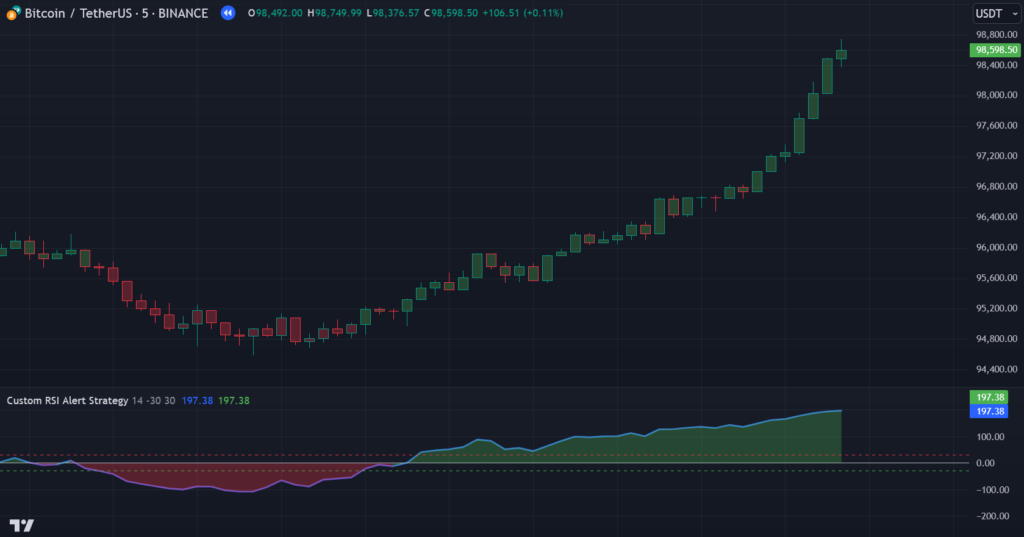
- Green: The bar is colored green when the RSI is above the lower level (-30), indicating that the market is in a bullish trend or potential buying opportunity.
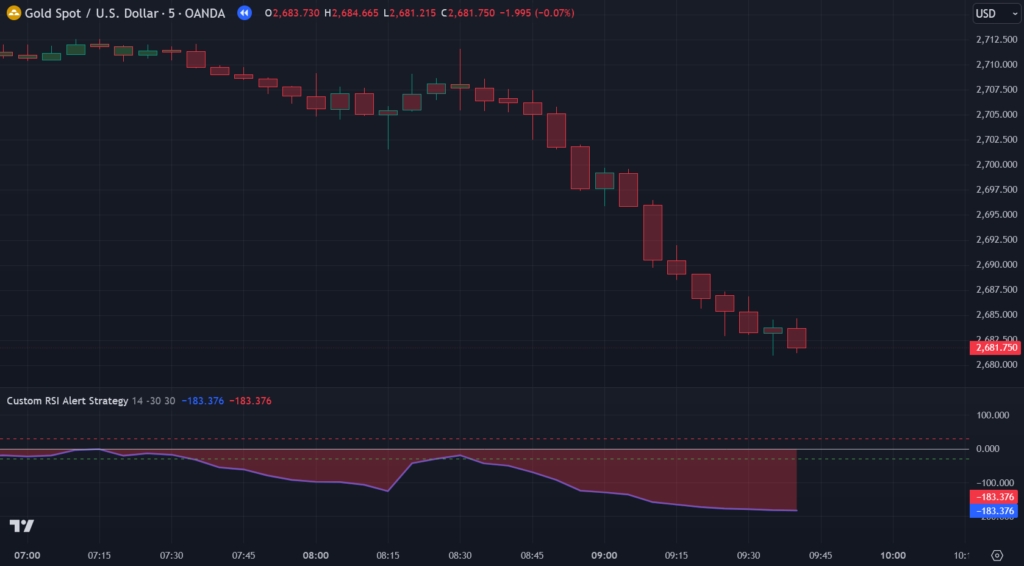
- Red: When the RSI falls below the higher level (30), the bar turns red, signaling a bearish trend or a potential sell opportunity.
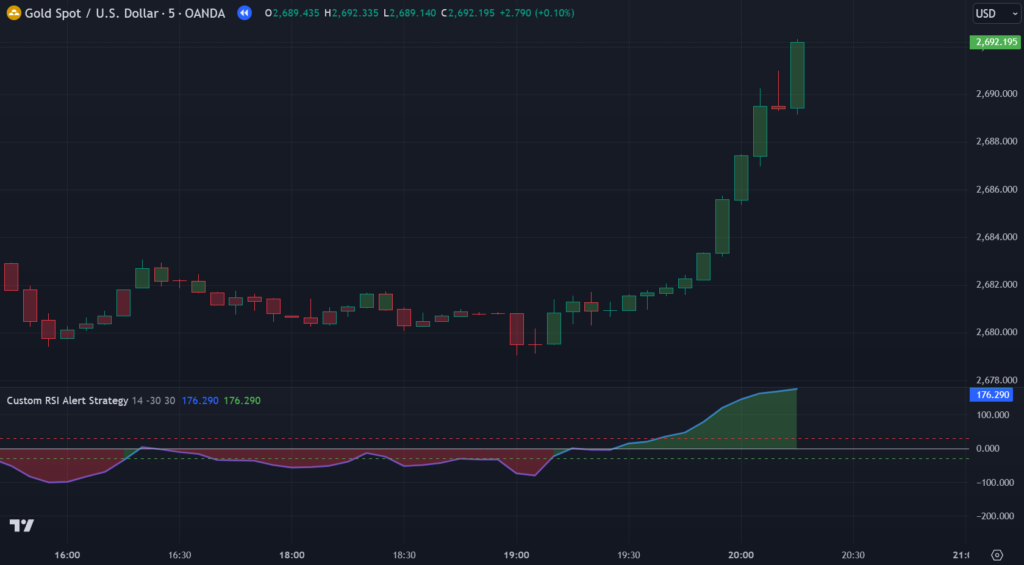
- Blue: The bar turns blue when the RSI is between the two levels, indicating neutral market conditions where neither buyers nor sellers dominate.
This visual representation of the RSI gives traders a clearer understanding of market trends and potential entry/exit points.
Area Plot
Another crucial feature is the area plot, which further enhances the visualization of the RSI:
- Green Area: When the RSI is above the neutral level (30), the area is filled with green, signaling a positive market sentiment or a bullish trend.
- Red Area: Conversely, when the RSI falls below the lower level (-30), the area is filled with red, indicating a negative sentiment or bearish trend.
- Blue Area: When the RSI is in the neutral zone, the area is filled with blue, indicating indecision or a balanced market.
This color-coded area plot, combined with the dynamic bar coloring, makes it much easier for traders to spot trend shifts and potential reversal points at a glance.
How Custom RSI Alert Strategy Indicator on TradingView Works on TradingView
On TradingView, the Custom RSI Alert Strategy indicator is implemented using Pine Script, TradingView’s proprietary scripting language. Pine Script allows traders to create custom indicators and strategies that can be used directly on TradingView charts.
Here’s how the Custom RSI Alert Strategy indicator works on TradingView:
- Script Setup: The Pine Script for this indicator is written to plot the RSI values on the chart. It also calculates the dynamic color changes based on the RSI’s position relative to the defined levels.
- Visual Elements: The script creates three key visual elements on the chart:
- The RSI values plotted as an area with dynamic color changes.
- The horizontal lines at the lower (-30) and upper (30) levels to identify potential overbought and oversold conditions.
- The color-coded bars that change based on the RSI’s value.
- Customization: As a trader, you can customize the indicator to fit your trading style. You can adjust the level thresholds (e.g., changing the -30 and 30 levels) or modify the colors for a personalized experience.
- Alert Signals: By setting up alerts within TradingView, traders can receive real-time notifications when the RSI crosses key levels or when bar colors change. This feature is especially useful for automating trading strategies or monitoring multiple charts at once.
Benefits of Using the Custom RSI Alert Strategy Indicator
The Custom RSI Alert Strategy indicator on TradingView provides several key benefits to traders:
- Improved Visualization: The dynamic color changes and area plot make the RSI data visually engaging, allowing traders to quickly spot trends, reversals, and overbought/oversold conditions.
- Easy Interpretation: The color-coded bars and area plots make it easier to understand the RSI’s behavior without having to interpret the raw numbers. This is especially helpful for traders who are new to RSI or prefer a more intuitive visual representation.
- Trend Identification: By using the indicator, traders can easily identify whether the market is in a bullish, bearish, or neutral state, helping to make more informed trading decisions.
- Custom Alerts: With TradingView alerts, traders can set custom notifications for when the RSI crosses key levels or when the color of the bars changes, automating some aspects of their trading strategies.
Conclusion
The Custom RSI Alert Strategy indicator on TradingView is a powerful tool for traders who want to enhance their technical analysis with a more intuitive and visually appealing version of the RSI. By using dynamic bar coloring, area plots, and customizable levels, this indicator simplifies the process of identifying trends, reversals, and market conditions.
Traders can leverage Pine Script to modify the indicator for their specific needs, and TradingView’s alert system ensures they stay updated on key market movements in real-time. Whether you’re a seasoned trader or just starting, this custom RSI indicator can be a valuable addition to your TradingView setup.
By implementing this advanced RSI strategy, traders can better spot trading opportunities, refine their entry and exit strategies, and ultimately improve their trading performance.
Pinescript of Custom RSI Alert Strategy Indicator on TradingView
Get access to this indicator by contacting us at +91 7620658346. We specialize in custom algorithm development for TradingView, MT4/MT5, and trading bots.
Follow @algo_aakash on Instagram, YouTube, and Twitter for the latest updates.
Disclaimer
The information presented in this article and any associated indicators is for educational purposes only. Trading in financial markets involves considerable risk, and there is no guarantee of profit. The custom Bollinger Band strategy relies on historical data and technical analysis, which may not accurately predict future market trends. Users should perform their own research, evaluate their risk tolerance, and seek advice from a licensed financial advisor before making any trading decisions. The author and developer of this indicator are not liable for any losses incurred from the use of this strategy. Please trade responsibly.
0 Comments