🔓 Get All Tools for FREE!
- ✅ Click here to open a trading account using our referral link and start trading.
- 📅 After 7 days of active trading under our referral link, you can get access to all tools in your account.
- ⚠️ Keep trading to keep access free — if you're inactive for 7 days, your access will be removed.
- 👉 Already have an account? You can change the IB (introducing broker) to our referral link ( https://one.exnesstrack.org/a/w7syl3vnjb ) and still qualify!
In the fast-paced world of trading, identifying key support and resistance zones is crucial for making informed decisions. The Supply/Demand Indicator on TradingView offers traders a powerful tool to automatically detect these critical price levels using advanced calculations and a combination of multiple technical indicators. Built with PineScript, TradingView’s native scripting language, this indicator helps you quickly identify areas where price is likely to reverse, giving you an edge in the market.
In this guide, we’ll explore how this indicator works, its key features, and how you can use it effectively to improve your trading strategy.
What is the Supply Demand Indicator?
The Supply/Demand Indicator is a custom-built tool designed to automatically identify and plot support (demand) and resistance (supply) zones on a chart. These zones represent key price levels where market participants expect price to either reverse or face significant resistance. The indicator combines various technical analysis methods, including RSI, EMA, and other custom calculations, to calculate the “GodMode” value that helps pinpoint these areas.
🔓 Get All Tools for FREE!
- ✅ Click here to open a trading account using our referral link and start trading.
- 📅 After 7 days of active trading under our referral link, you can get access to all tools in your account.
- ⚠️ Keep trading to keep access free — if you're inactive for 7 days, your access will be removed.
- 👉 Already have an account? You can change the IB (introducing broker) to our referral link ( https://one.exnesstrack.org/a/w7syl3vnjb ) and still qualify!
By using Pine Script, the indicator is fully customizable, allowing traders to adjust inputs for short-term, channel, and average lengths, ensuring it fits various market conditions and strategies.
How the Supply Demand Indicator Works on TradingView
The Supply/Demand Indicator works by analyzing the price action and calculating the most relevant price levels based on market behavior. Here’s how it functions:
- Short-Term, Channel, and Average Length Inputs:
- The indicator offers configurable inputs for short-term, channel, and average lengths. These settings allow traders to adjust the indicator to different market conditions, whether you’re trading in a volatile or a trending market.
- These inputs ensure the indicator’s ability to adapt to changing market dynamics, offering flexibility for all types of traders.
- GodMode Calculation:
- The GodMode value is a proprietary calculation used to determine supply and demand zones. It combines the analysis of multiple technical indicators such as the Relative Strength Index (RSI), Exponential Moving Averages (EMA), and other custom formulas.
- This “GodMode” value gives traders a clearer understanding of the market’s underlying strength, making it easier to identify potential areas of price reversal.
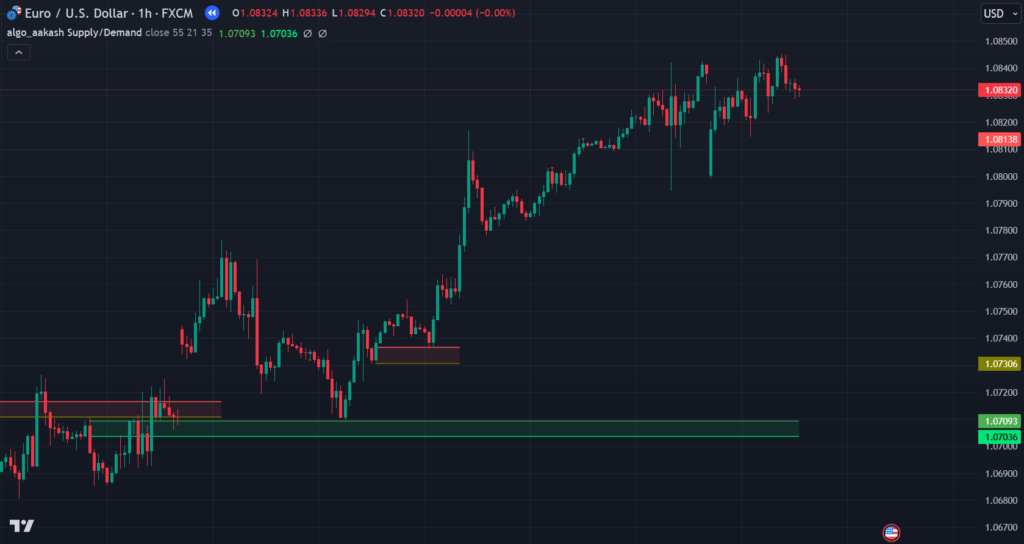
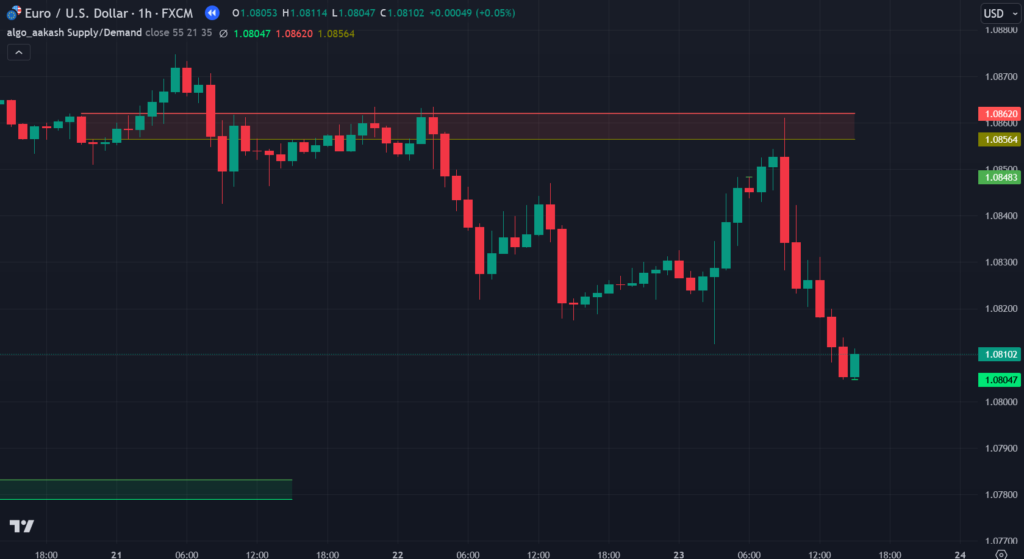
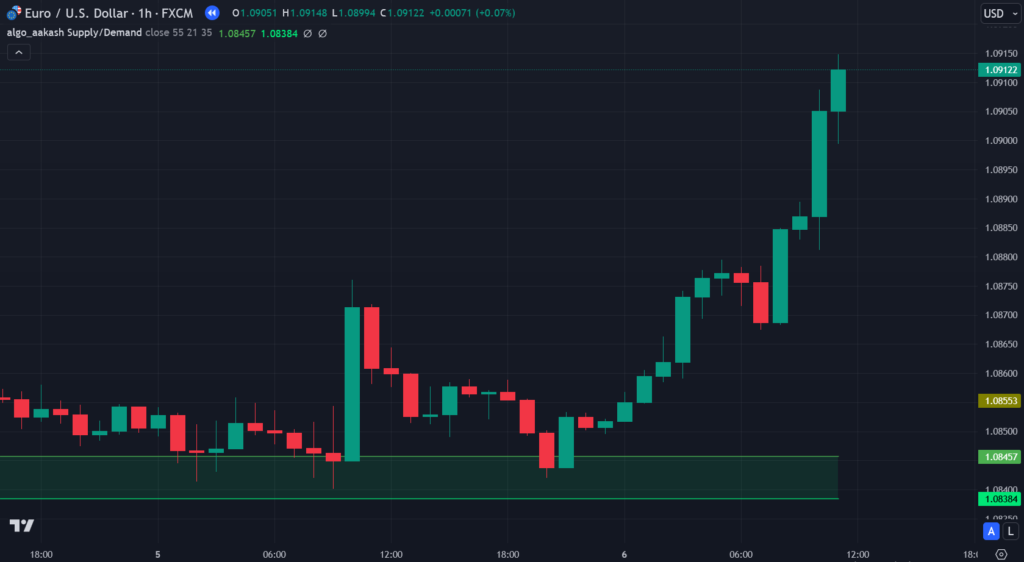
- Supply and Demand Zones:
- Once the GodMode value is calculated, the indicator automatically plots support and resistance zones on the chart. These zones represent key price levels where price action is likely to reverse.
- The indicator uses smooth calculations to better visualize these zones, making it easier to spot critical levels without manually drawing lines or analyzing price patterns.
- Upward/Downward Movement Detection:
- The indicator also detects upward and downward movements based on market strength. When the RSI is above 70, it indicates potential resistance (supply) zones, and when it is below 30, it signals support (demand) zones.
- This feature adds another layer of accuracy to the indicator, helping traders focus on the most significant price levels for entry or exit points.
Key Features of the Supply Demand Indicator
The Supply/Demand Indicator comes with several key features that make it an essential tool for traders. These features work together to enhance trading accuracy and simplify the chart analysis process:
- Configurable Inputs for Flexibility:
- The ability to adjust short-term, channel, and average length inputs gives traders the flexibility to tailor the indicator to their trading style and market conditions. Whether you’re trading on lower timeframes or longer-term charts, this indicator can be customized to suit your needs.
- “GodMode” Calculation for Improved Accuracy:
- The GodMode calculation, which incorporates multiple indicators like RSI and EMA, offers an advanced method of detecting supply and demand zones. This calculation improves the indicator’s accuracy in identifying key price levels that may lead to reversals.
- Automatic Detection of Support and Resistance Zones:
- The most significant feature of this indicator is its ability to automatically identify and plot support and resistance zones. This saves traders time by eliminating the need for manual charting and allowing them to focus on making decisions based on real-time data.
- Clear Visual Representation with Color-Coded Plots:
- The indicator uses color-coded plots and filled areas to clearly represent supply and demand zones. This visual clarity helps traders easily spot critical price levels without confusion, making it easier to execute trades with confidence.
- Enhanced Reversal Detection:
- By detecting potential price reversal zones, the indicator enables traders to anticipate market movements before they occur. The zones are color-coded to highlight areas of possible upward or downward movements, providing valuable insight into entry and exit opportunities.
How to Use the Supply Demand Indicator on TradingView
Using the Supply/Demand Indicator on TradingView is straightforward. Here’s a step-by-step guide on how to implement it into your trading strategy:
- Install the Indicator:
- Search for the Supply/Demand Indicator in the TradingView indicators section, or load a custom script created with Pine Script.
- Add the indicator to your chart, and adjust the inputs to suit your preferred settings, such as short-term, channel, and average length.
- Interpret the Supply and Demand Zones:
- Once the indicator is applied, look for the supply (resistance) and demand (support) zones plotted on the chart. These areas represent critical price levels where price is likely to reverse.
- Pay close attention to the color-coded plots—green for support and red for resistance—these help you quickly identify potential trade opportunities.
- Monitor the Market for Potential Reversals:
- When the price approaches a supply or demand zone, watch for signs of price reversal. If the RSI is above 70, expect resistance; if it’s below 30, expect support.
- Look for candle patterns or other technical indicators that align with the zone to confirm your entry or exit signal.
- Adjust Settings for Different Markets:
- Depending on the market you’re trading, such as forex, crypto, or stocks, you can fine-tune the indicator’s settings to match the market’s behavior. Use the short-term, channel, and average length inputs to adapt to different timeframes and volatility.
Conclusion
The Supply Demand Indicator on TradingView is an invaluable tool for traders looking to improve their decision-making process by identifying key price levels where the market is likely to reverse. With its advanced Pine Script calculations, automatic detection of support and resistance zones, and clear visual representation, it helps traders focus on the most critical areas of price action.
By incorporating this indicator into your trading strategy, you can save time on manual chart analysis, improve your accuracy in detecting price reversals, and enhance your overall trading performance. Whether you’re a beginner or an experienced trader, this Supply Demand Indicator is a must-have tool for your TradingView toolkit.
Pinescript of Supply Demand TradingView Indicator
For access to this indicator, contact us at +91 7620658346. We specialize in algo development for TradingView, MT4/MT5, and trading bots.
Follow @algo_aakash on Instagram, YouTube, and Twitter for updates!
Disclaimer
The content in this article and any related indicators is for educational purposes only. Trading in financial markets involves a high level of risk, and there is no guarantee of profits. The custom Bollinger Band strategy relies on historical data and technical analysis, which may not accurately predict future market movements. Users should conduct their own research, evaluate their risk tolerance, and consult with a licensed financial advisor before making any trading decisions. The author and developer of this indicator are not responsible for any losses incurred from using this strategy. Please trade responsibly.

0 Comments