🔓 Get All Tools for FREE!
- ✅ Click here to open a trading account using our referral link and start trading.
- 📅 After 7 days of active trading under our referral link, you can get access to all tools in your account.
- ⚠️ Keep trading to keep access free — if you're inactive for 7 days, your access will be removed.
- 👉 Already have an account? You can change the IB (introducing broker) to our referral link ( https://one.exnesstrack.org/a/w7syl3vnjb ) and still qualify!
What is the Indicator: Relative Strength Index – Divergences – Libertus?
The Relative Strength Index (RSI) – Divergences – Libertus is a powerful custom tool designed to assist traders in detecting trend reversals and market shifts by highlighting potential divergences and pivot points on the RSI. This indicator integrates with TradingView and uses advanced Pine Script programming to identify key signals for traders.
RSI itself is a well-known technical analysis tool that measures the speed and change of price movements, typically to determine overbought or oversold conditions. However, the Libertus version adds an extra layer of insight by automatically identifying divergences (both bullish and bearish) and key pivot points within the RSI. These elements can provide early signals for potential price movements, making it a valuable tool for anyone trading on TradingView.
🔓 Get All Tools for FREE!
- ✅ Click here to open a trading account using our referral link and start trading.
- 📅 After 7 days of active trading under our referral link, you can get access to all tools in your account.
- ⚠️ Keep trading to keep access free — if you're inactive for 7 days, your access will be removed.
- 👉 Already have an account? You can change the IB (introducing broker) to our referral link ( https://one.exnesstrack.org/a/w7syl3vnjb ) and still qualify!
How the RSI Divergences – Libertus Indicator Works on TradingView
To understand how this custom indicator functions, we need to break down its core features and how they contribute to decision-making in trading.
1. RSI Calculation and Levels
The Relative Strength Index (RSI) is calculated by comparing the magnitude of recent gains to recent losses over a specified period, typically 14 periods. The RSI produces a value between 0 and 100, where:
- Values above 70 are considered overbought (indicating a potential price decline).
- Values below 30 are considered oversold (indicating a potential price increase).
- The 50 level serves as a midpoint, where values above 50 suggest upward momentum and values below 50 suggest downward momentum.
The RSI Divergences – Libertus indicator allows traders to adjust these thresholds to better fit their specific trading style and market conditions, providing greater flexibility in its application.
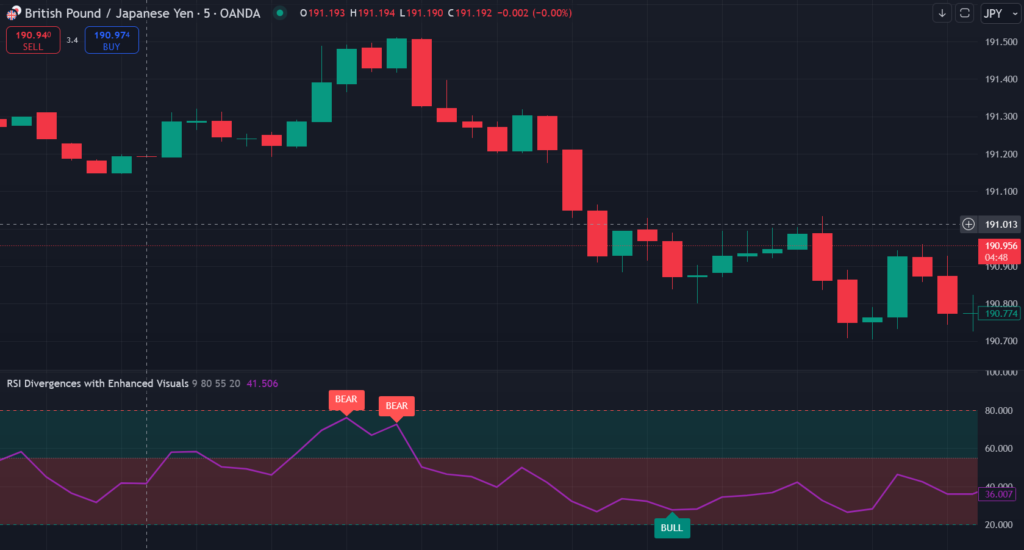
2. Divergences Detection
The key to the Libertus indicator’s effectiveness lies in its ability to detect divergences between price action and the RSI. Divergences are important signals of potential reversals, and the indicator highlights these with labels directly on the chart for easy identification.
- Bearish Divergence occurs when the price forms a higher high while the RSI forms a lower high, signaling a potential reversal to the downside. This suggests that although the price is rising, momentum is weakening.
- Bullish Divergence occurs when the price forms a lower low, but the RSI forms a higher low, signaling a potential reversal to the upside. This indicates that although the price is falling, buying pressure is building.
These divergences are key to spotting trend reversals, as they typically signal that the prevailing trend may be losing strength.
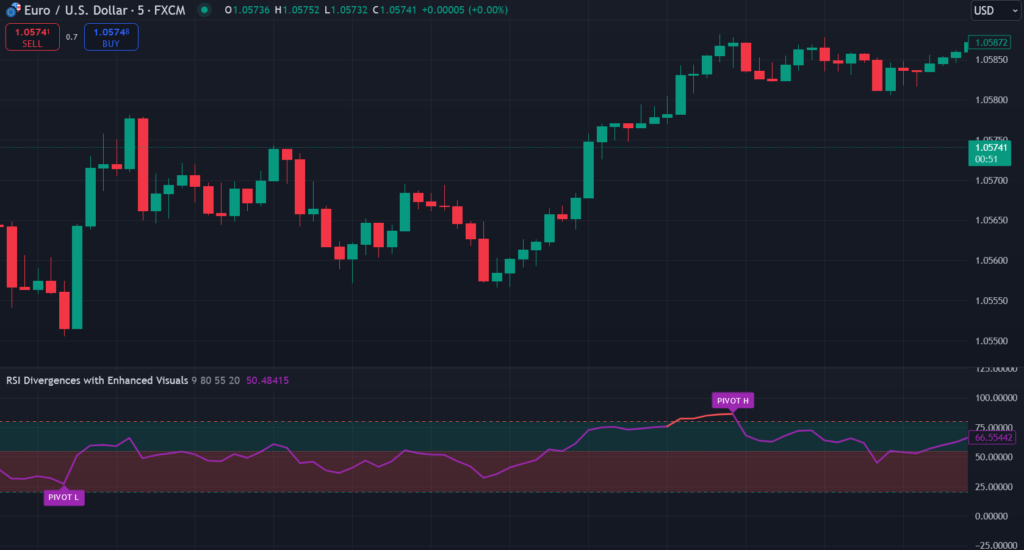
3. Pivot Points Identification
Another important feature of the RSI Divergences – Libertus indicator is its ability to detect pivot points on the RSI, which are key turning points that indicate potential changes in trend direction.
- The indicator automatically identifies local highs and local lows on the RSI, helping traders visualize areas where the market may change direction. These pivot points, when combined with divergence signals, can provide confirmation of potential entry and exit points.
Features of the RSI Divergences – Libertus Indicator
The RSI Divergences – Libertus indicator on TradingView comes with several features designed to enhance its usability and effectiveness for traders:
- Customizable RSI Settings: Traders can adjust the RSI length, overbought and oversold thresholds, as well as midline visibility for optimal settings based on their trading strategy.
- Divergence and Pivot Labels: The indicator automatically places labels directly on the chart to mark bullish and bearish divergences and pivot points, making it easy for traders to spot potential trend shifts.
- Visual Enhancements: The indicator offers color-coded backgrounds and dynamic labels, which improve the clarity of the signals, allowing traders to interpret the data at a glance.
- Optional Short Labels and Background: For traders who prefer a cleaner look, the option to reduce or hide labels and background features is available.
These features make the RSI Divergences – Libertus indicator one of the most powerful tools for identifying trend reversals and shifts in momentum, especially when used in conjunction with other technical analysis tools on TradingView.
How the Indicator Benefits Traders
The RSI Divergences – Libertus indicator can be extremely beneficial for various types of traders, especially those focused on identifying reversals and momentum shifts. Here’s how it enhances decision-making:
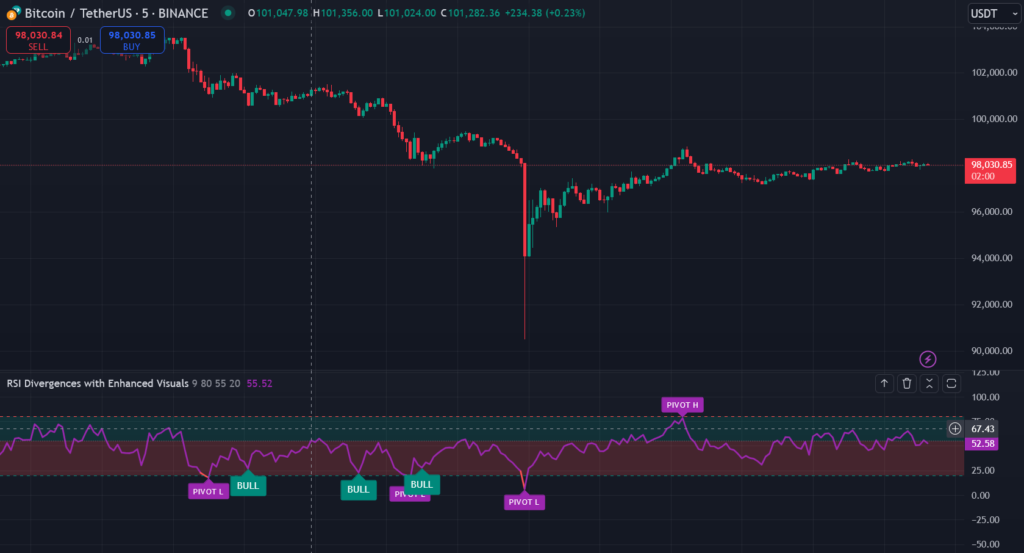
1. Spotting Early Reversal Signals with Divergences
One of the biggest advantages of using this indicator is its ability to detect divergences, which are often early signs of a potential market reversal. Bullish divergences signal a buying opportunity, while bearish divergences suggest a potential sell signal. These signals can help traders enter or exit positions before the market confirms the change in direction, potentially maximizing profits.
2. Confirming Entry and Exit Points
By marking key pivot points and divergences, the indicator helps traders confirm their entry and exit points. When the RSI moves into oversold or overbought conditions, combined with a divergence, traders can make more informed decisions about whether to buy or sell.
3. Enhanced Market Insights
The visual enhancements and labels on the chart help traders quickly assess the market conditions. For example, seeing that the RSI has formed a bearish divergence while the price makes a higher high can indicate that the trend is likely to reverse. This added insight helps traders make more confident, data-driven decisions.
Ideal Use Cases for the RSI Divergences – Libertus Indicator
This indicator is particularly useful for swing traders and scalpers. Swing traders can use the indicator to spot medium-term reversals based on divergences and pivot points, while scalpers can take advantage of short-term shifts in momentum. Both groups of traders can use this tool to identify precise entry and exit points, improving the overall effectiveness of their trading strategy.
Conclusion
The RSI Divergences – Libertus indicator, powered by Pine Script, is an essential tool for traders using TradingView. By detecting key divergences and pivot points, this indicator helps traders identify potential trend reversals and shifts in market momentum. With its customizable features and visual enhancements, it allows traders to make informed decisions, whether they are entering or exiting positions. It’s an invaluable asset for any trader looking to optimize their analysis and improve decision-making in the fast-paced world of financial markets.
Pinescript of Relative Strength Index – Divergences – Libertus Tradingview Indicator
Contact us at +91 7620658346 to unlock this indicator. We specialize in developing algorithms for TradingView, MT4/MT5, and trading bots.
Follow @algo_aakash on Instagram, YouTube, and Twitter for the latest updates!
Disclaimer
The information in this article and any related indicators is intended for educational purposes only. Trading financial markets involves significant risk, and there is no guarantee of profit. The custom Bollinger Band strategy is based on historical data and technical analysis, which may not accurately predict future market movements. Users should perform their own research, assess their risk tolerance, and consult with a licensed financial advisor before making any trading decisions. The author and developer of this indicator are not liable for any losses incurred through the use of this strategy. Please trade responsibly.

0 Comments