🔓 Get All Tools for FREE!
- ✅ Click here to open a trading account using our referral link and start trading.
- 📅 After 7 days of active trading under our referral link, you can get access to all tools in your account.
- ⚠️ Keep trading to keep access free — if you're inactive for 7 days, your access will be removed.
- 👉 Already have an account? You can change the IB (introducing broker) to our referral link ( https://one.exnesstrack.org/a/w7syl3vnjb ) and still qualify!
Indicators are critical tools for traders, helping to identify key market levels and trends. One such valuable tool is the Pivot High-Low Support and Resistance Levels Indicator available on TradingView, which leverages pivot points to pinpoint significant price levels. This article explores how the indicator works, its features, and how traders can use it to make informed decisions.
What is the Pivot High-Low Support and Resistance Levels TradingView Indicator
The Pivot High-Low Indicator identifies critical support and resistance zones in the market by analyzing price action and calculating pivot points. Here’s a detailed explanation of its functionality:
1. Pivot High/Low Calculation
- Pivot High: A Pivot High is identified when a bar’s price is higher than the surrounding bars within a defined range.
- Pivot Low: A Pivot Low is detected when a bar’s price is lower than the surrounding bars in the same range.
- The indicator uses two customizable inputs:
- pivotLengthLeft: The number of bars to the left of the pivot point to consider.
- pivotLengthRight: The number of bars to the right of the pivot point to consider.
This flexibility allows traders to tailor the indicator to different timeframes and market conditions.
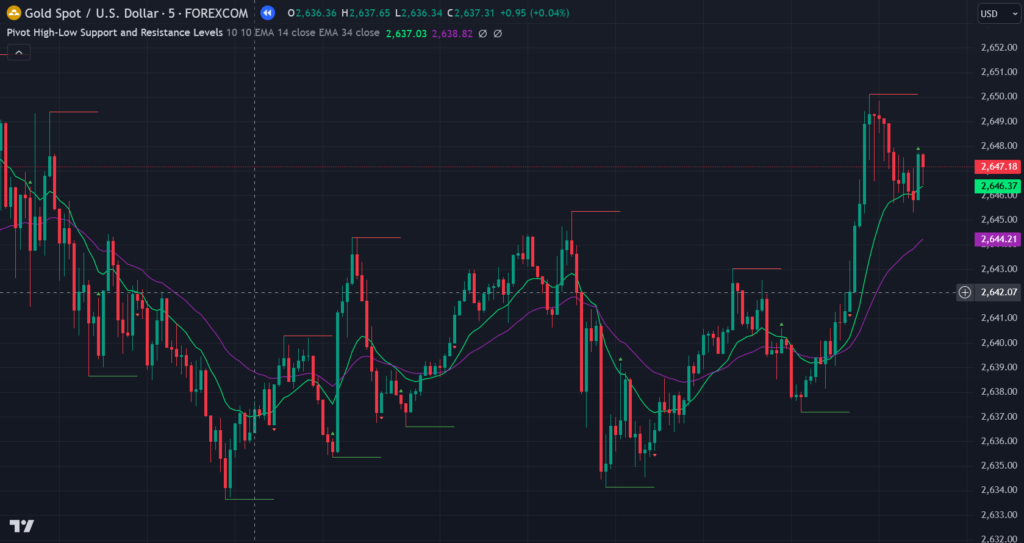
2. Moving Averages (MAs) for Trend Analysis
- The indicator incorporates two moving averages: a fast MA and a slow MA.
- Fast MA: Reacts quickly to price movements, offering insights into short-term trends.
- Slow MA: Provides a broader perspective on the overall market trend.
- Traders can select from multiple MA types, including SMA, EMA, WMA, and Hull MA, ensuring compatibility with various trading strategies.
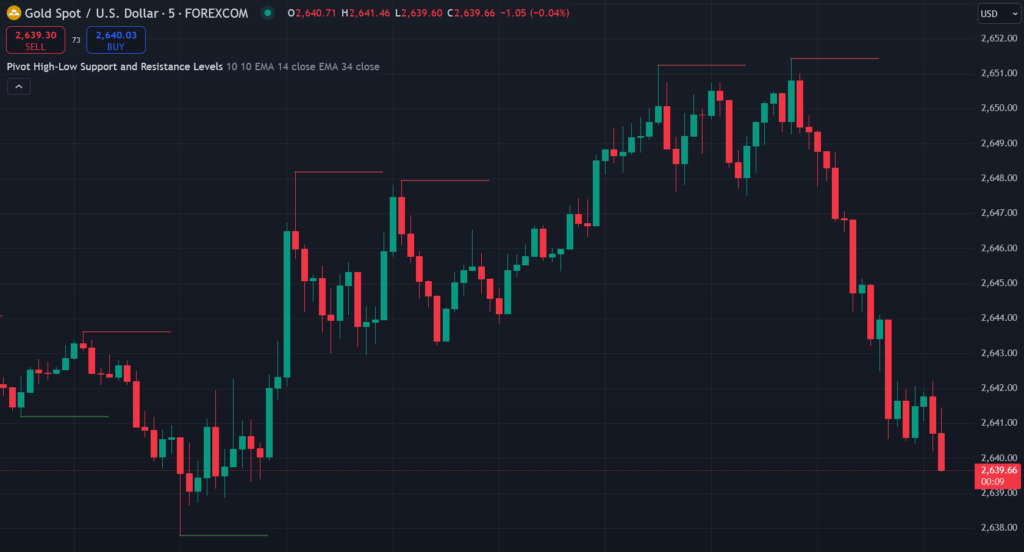
3. Support and Resistance Levels
- Horizontal lines are drawn at identified Pivot Highs and Pivot Lows, highlighting potential support and resistance zones.
- These levels help traders spot areas where price may reverse, stall, or break out, providing opportunities for strategic entries and exits.
Key Features of the Pivot High-Low Indicator
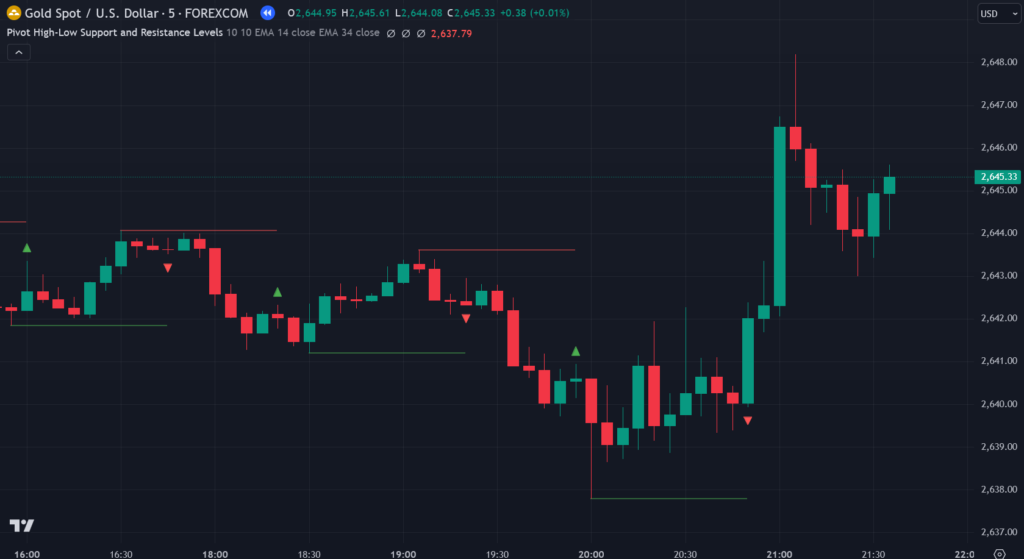
- Pivot Markers
- The indicator displays visual markers:
- Green triangles at Pivot Highs.
- Red triangles at Pivot Lows.
- These markers make it easy to identify critical levels at a glance.
- The indicator displays visual markers:
- Customizable Pivot Length
- Traders can adjust the left and right pivot lengths, allowing them to fine-tune the sensitivity of the indicator based on market conditions.
- Moving Average Filters
- The option to enable or disable Moving Average (MA) filters helps in reducing noise and false signals.
- When enabled, the indicator aligns pivot-based signals with the overall trend direction indicated by the moving averages.
- Support and Resistance Visualization
- Horizontal support and resistance lines provide a clear framework for price action analysis. These lines highlight areas where the market might face buying or selling pressure.
- MA Type Selection
- With the ability to choose from multiple moving average types (SMA, EMA, WMA, and more), traders can adapt the indicator to their preferred analysis approach.
How Pivot High-Low Support and Resistance Levels TradingView Indicator?
TradingView is renowned for its intuitive interface and robust tools, making it an ideal platform to use the Pivot High-Low Indicator. Here’s why this indicator is beneficial:
🔓 Get All Tools for FREE!
- ✅ Click here to open a trading account using our referral link and start trading.
- 📅 After 7 days of active trading under our referral link, you can get access to all tools in your account.
- ⚠️ Keep trading to keep access free — if you're inactive for 7 days, your access will be removed.
- 👉 Already have an account? You can change the IB (introducing broker) to our referral link ( https://one.exnesstrack.org/a/w7syl3vnjb ) and still qualify!
1. Trend Identification
The inclusion of moving averages helps traders gauge the overall market trend, distinguishing between bullish and bearish conditions. By aligning pivot signals with the trend direction, traders can increase the probability of successful trades.
2. Support and Resistance Insights
Pivot points serve as critical support and resistance levels. Traders can use these zones to anticipate price reversals, breakouts, or consolidation, enabling strategic trade placement.
3. Entry and Exit Signals
The indicator provides actionable signals:
- Buy Opportunities: When the price breaks above a Pivot High.
- Sell Opportunities: When the price breaks below a Pivot Low.
Additionally, the horizontal lines and moving averages provide context for exits, helping to manage risk effectively.
4. Flexibility and Customization
Traders can customize every aspect of the indicator, from pivot lengths to moving average types and display preferences. This adaptability makes it suitable for various trading styles, including scalping, swing trading, and long-term investing.
5. Seamless Integration with Pine Script
For advanced traders, Pine Script on TradingView allows further customization of the indicator. Users can:
- Add alerts for key levels and pivot reversals.
- Automate strategies based on the indicator’s signals.
- Backtest the indicator to evaluate its historical performance.
Using the Indicator Effectively
Steps to Get Started on TradingView
- Add the Indicator
- Search for the Pivot High-Low Indicator in the TradingView indicator library, or create a custom version using Pine Script.
- Customize Settings
- Adjust pivot lengths and MA parameters to align with your trading style and the chosen market.
- Analyze Key Levels
- Identify support and resistance zones using the horizontal lines drawn by the indicator.
- Observe Pivot Highs and Lows to anticipate potential price reversals or breakouts.
- Combine with Other Tools
- Use the indicator alongside other technical tools such as trendlines, Fibonacci retracements, and volume analysis to confirm signals.
- Set Alerts
- Leverage TradingView’s alert system to receive notifications for price movements around Pivot Highs, Lows, and support/resistance levels.
Conclusion
The Pivot High-Low Support and Resistance Levels Indicator is a versatile tool for identifying critical market levels and trends. By leveraging pivot points, moving averages, and customizable features, traders can gain a clear understanding of market dynamics. On TradingView, this indicator integrates seamlessly with other tools and features, making it an invaluable addition to any trader’s toolkit. Start using this indicator today to refine your trading strategy and enhance decision-making in dynamic markets!
Pinescript of Pivot High-Low Support and Resistance Levels TradingView Indicator
Get this indicator by contacting us at +91 7620658346. We specialize in developing TradingView indicators, MT4/MT5 solutions, and trading bots.
Follow @algo_aakash on Instagram, YouTube, and Twitter to stay updated!
Disclaimer
The information presented in this article and any associated indicators is for educational purposes only. Trading financial markets involves significant risk, and there is no guarantee of profit. The custom Bollinger Band strategy is based on historical data and technical analysis, which may not necessarily predict future market outcomes. Users should conduct their own research, evaluate their risk tolerance, and consult with a licensed financial advisor before making any trading decisions. The author and developer of this indicator are not responsible for any losses incurred through the use of this strategy. Please trade responsibly.

0 Comments