🔓 Get All Tools for FREE!
- ✅ Click here to open a trading account using our referral link and start trading.
- 📅 After 7 days of active trading under our referral link, you can get access to all tools in your account.
- ⚠️ Keep trading to keep access free — if you're inactive for 7 days, your access will be removed.
- 👉 Already have an account? You can change the IB (introducing broker) to our referral link ( https://one.exnesstrack.org/a/w7syl3vnjb ) and still qualify!
For traders looking to refine their strategies, TradingView offers a powerful tool called the Multi Supertrend Indicator. This indicator enhances trend-following strategies by combining multiple Supertrend calculations into one tool. By providing clearer buy and sell signals, the Multi Supertrend Indicator helps traders make more informed decisions. In this guide, we’ll explain what the Multi Supertrend Indicator is, how it works on TradingView, and the benefits of using it.
What is the Multi Supertrend Indicator?
The Multi Supertrend Indicator is a trend-following tool that combines three independent Supertrend calculations. The Supertrend indicator is widely used in technical analysis because it adjusts for market volatility using the Average True Range (ATR). The Multi Supertrend Indicator takes this concept further by combining three Supertrend lines, each with its own settings for ATR length and multiplier factor. This results in a more comprehensive analysis of the market trend, making it easier to identify potential entry and exit points.
🔓 Get All Tools for FREE!
- ✅ Click here to open a trading account using our referral link and start trading.
- 📅 After 7 days of active trading under our referral link, you can get access to all tools in your account.
- ⚠️ Keep trading to keep access free — if you're inactive for 7 days, your access will be removed.
- 👉 Already have an account? You can change the IB (introducing broker) to our referral link ( https://one.exnesstrack.org/a/w7syl3vnjb ) and still qualify!
Key Features of the Multi Supertrend Indicator
- Three Supertrend Lines:
One of the standout features of the Multi Supertrend Indicator is the use of three different Supertrend lines. Each line has independent settings for the ATR length (which determines the period over which volatility is measured) and the multiplier factor (which dictates how sensitive the Supertrend is to price movements). By using three separate lines, the indicator provides a more reliable analysis of the overall market trend. - Buy/Sell Signals:
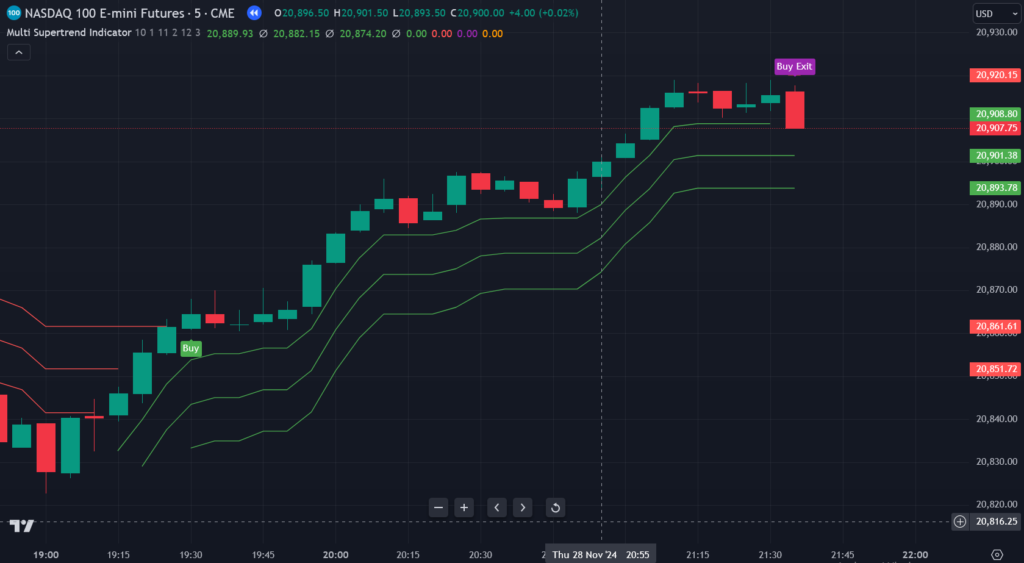
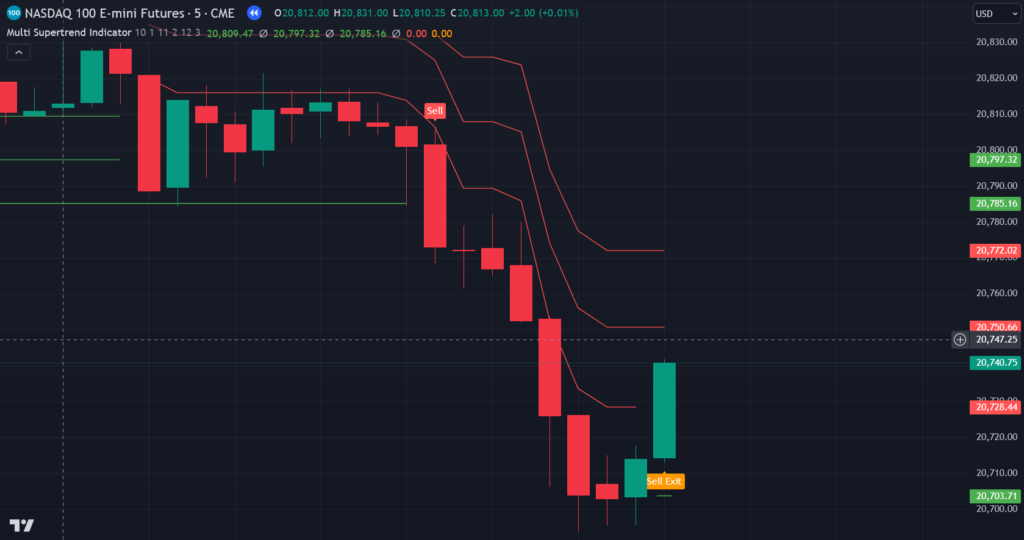
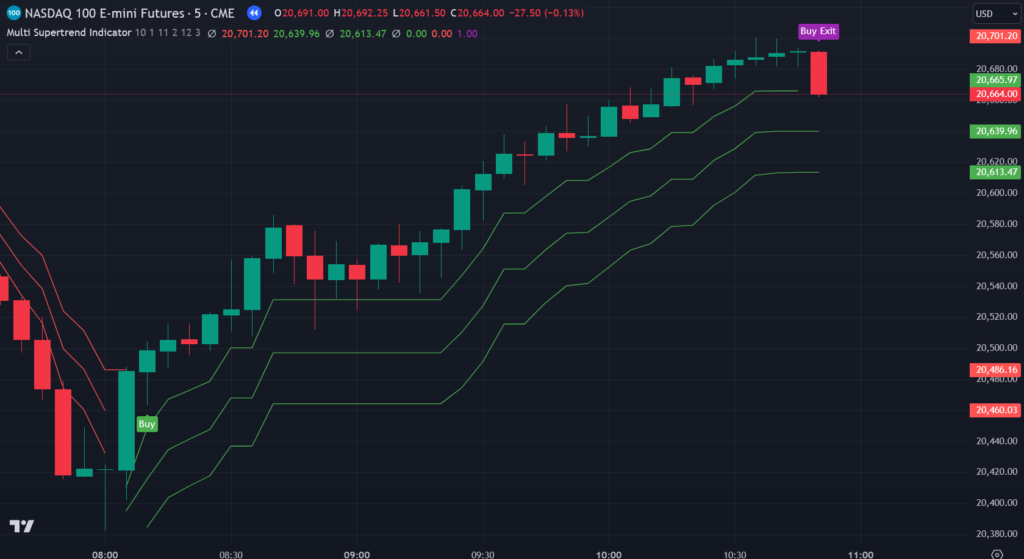
The Multi Supertrend Indicator generates buy and sell signals when all three Supertrend lines align. For example, if all three Supertrend lines are in an uptrend (green), it triggers a Buy signal. Conversely, when all three lines are in a downtrend (red), a Sell signal is activated. This alignment increases the accuracy of the signals, reducing the likelihood of false indications. - Exit Signals:
The indicator also provides exit signals, which are essential for managing your trades. These exit signals occur when there’s a reversal in the trend of any of the Supertrend lines. If one of the Supertrend lines switches direction, indicating a potential market reversal, the Multi Supertrend Indicator will generate an exit signal, helping you close your positions at the right time. - Visual Labels:
To make it easier for traders to interpret the signals, the Multi Supertrend Indicator displays clear visual labels on the chart. When a Buy or Sell signal is generated, a label appears on the chart, indicating the exact point where the signal was triggered. This visual clarity ensures that traders can easily spot entry and exit points without having to analyze the data manually.
How the Multi Supertrend Indicator Works on TradingView
TradingView is one of the most popular platforms for charting and analyzing financial markets. The Multi Supertrend Indicator works seamlessly with TradingView, providing traders with a convenient way to track market trends and make informed decisions.
- Setting Up the Indicator:
To use the Multi Supertrend Indicator on TradingView, simply access the Indicators section and search for “Multi Supertrend” in the library. It may be available as a pre-built indicator, or you can create a custom version. Once added to your chart, the indicator will automatically display the three Supertrend lines, each based on different settings for ATR length and multiplier. - Customization:
TradingView allows you to customize the settings of the Multi Supertrend Indicator. The ATR length and multiplier factor can be adjusted for each of the three Supertrend lines. This customization gives you the flexibility to fine-tune the indicator based on your trading style, the market conditions, or the asset you’re trading. For example, you might want to use a shorter ATR length and lower multiplier for faster-moving markets or a longer ATR length for slower-moving markets. - Signal Interpretation:
- Buy Signal: When all three Supertrend lines are in an uptrend (green), a Buy signal is generated. This is typically seen as a strong indication that the market is in a bullish trend, and it’s a good time to enter a long position.
- Sell Signal: When all three Supertrend lines are in a downtrend (red), a Sell signal is triggered. This indicates a strong bearish market condition, and it’s a good time to consider shorting the asset or exiting any long positions.
- Exit Signal: If any of the Supertrend lines reverses its trend, an Exit signal will appear. This helps traders close positions before a potential trend reversal, improving risk management and locking in profits.
Benefits of the Multi Supertrend Indicator
- More Accurate Trend Analysis:
By combining three Supertrend lines, the Multi Supertrend Indicator offers a more accurate and reliable trend analysis compared to a single Supertrend line. This aggregation of multiple signals helps traders make more confident decisions, especially when the signals align across all three lines. - Clear Buy/Sell Signals:
The clear buy and sell signals generated by the Multi Supertrend Indicator make it easier to identify key moments for market entry and exit. Whether you’re a beginner or an experienced trader, this clarity can help improve the timing of your trades. - Customizable for Different Markets:
The ability to adjust the ATR length and multiplier factor for each Supertrend line allows traders to adapt the indicator to various market conditions. Whether you’re trading stocks, forex, or cryptocurrencies, you can fine-tune the settings to match your strategy and the behavior of the asset you’re trading. - Exit Strategy:
The Multi Supertrend Indicator’s ability to generate exit signals based on trend reversals is a significant advantage. Exiting trades at the right time is crucial for risk management and maximizing profits. By using the Multi Supertrend Indicator, traders can reduce the risk of staying in a trade for too long and missing out on potential profits or sustaining unnecessary losses. - Visual Clarity:
The visual representation of buy and sell signals directly on the chart makes it easier for traders to spot key moments for action. The clear labels and color-coded trend lines ensure that the signals are easy to interpret, even for traders who are new to technical analysis.
Conclusion
The Multi Supertrend Indicator on TradingView is a powerful and versatile tool that helps traders identify market trends more accurately. By combining three Supertrend lines with customizable settings, the indicator provides reliable buy and sell signals based on the alignment of all three lines. The inclusion of exit signals helps traders manage risk and lock in profits at the right time. With its clear visual labels and customization options, the Multi Supertrend Indicator is an excellent choice for traders who want a more reliable way to follow market trends and make informed trading decisions. Whether you’re trading stocks, forex, or cryptocurrencies, this tool is an invaluable addition to your trading strategy.
Pinescript of Multi Supertrend TradingView Indicator
For access to this indicator, contact us at +91 7620658346. We provide expert algo development for TradingView indicators, MT4/MT5, and trading bots.
Stay connected with @algo_aakash on Instagram, YouTube, and Twitter for the latest updates!
Disclaimer
The information provided in this article and any associated indicators is for educational purposes only. Trading financial markets involves substantial risk, and there is no guarantee of profit. The custom Bollinger Band strategy relies on historical data and technical analysis, which may not accurately predict future market conditions. Users should conduct their own research, assess their risk tolerance, and consult with a licensed financial advisor before making any trading decisions. The author and developer of this indicator are not liable for any losses incurred from using this strategy. Please trade responsibly.
0 Comments