🔓 Get All Tools for FREE!
- ✅ Click here to open a trading account using our referral link and start trading.
- 📅 After 7 days of active trading under our referral link, you can get access to all tools in your account.
- ⚠️ Keep trading to keep access free — if you're inactive for 7 days, your access will be removed.
- 👉 Already have an account? You can change the IB (introducing broker) to our referral link ( https://one.exnesstrack.org/a/w7syl3vnjb ) and still qualify!
In the world of technical analysis, identifying trends and key price movements is essential for making informed trading decisions. One powerful tool traders use to detect trends and breakouts is the Trendline Indicator, particularly the one based on Pine Script on TradingView. This indicator offers an automated and customizable way to draw trendlines and identify breakout or breakdown signals, making it an essential tool for both novice and experienced traders. In this article, we’ll explore how this Pine Script indicator works on TradingView, its key features, and how it can improve your trading strategy.
What is a Trendline Breakout Breakdown Indicator?
A trendline is a straight line that connects two or more price points on a chart, helping traders identify the direction of the market. Trendlines are fundamental in technical analysis, as they provide visual cues on the overall market trend, be it upward (bullish) or downward (bearish). In TradingView, the Pine Script Trendline Indicator automatically detects and plots these trendlines based on historical price action, offering a convenient solution for traders to visualize trends without drawing them manually.
🔓 Get All Tools for FREE!
- ✅ Click here to open a trading account using our referral link and start trading.
- 📅 After 7 days of active trading under our referral link, you can get access to all tools in your account.
- ⚠️ Keep trading to keep access free — if you're inactive for 7 days, your access will be removed.
- 👉 Already have an account? You can change the IB (introducing broker) to our referral link ( https://one.exnesstrack.org/a/w7syl3vnjb ) and still qualify!
This specific Pine Script indicator not only draws trendlines but also calculates trend slopes using three different methods: Linear Regression, Standard Deviation, and Average True Range (ATR). It also displays breakout or breakdown signals, helping traders spot significant price movements that could indicate potential entry or exit points.
Key Features of the Trendline Indicator on TradingView
The Trendline Indicator in Pine Script on TradingView offers several unique features that make it a valuable tool for technical traders:
1. Automatic Trendline Drawing
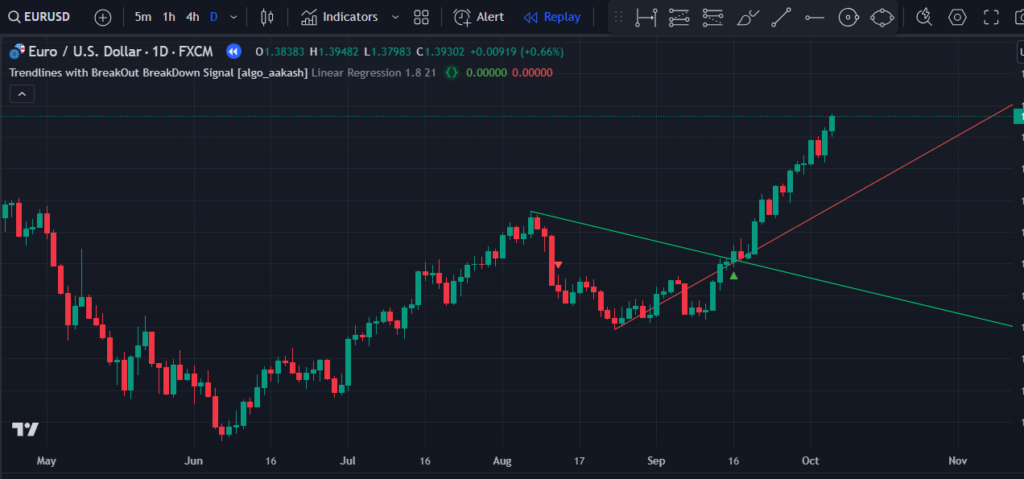
The indicator automatically draws upward (lime green) and downward (red) trendlines based on historical price action. The upward trendline connects the significant lows of the price action, while the downward trendline connects the highs. This feature helps traders avoid the time-consuming process of manually drawing trendlines on the chart, while still benefiting from accurate trend visualization.
The lime green upward trendline suggests bullish momentum, while the red downward trendline indicates bearish movement. These trendlines provide an immediate visual indication of the market’s direction, making it easier to identify trends and potential reversal points.
2. Three Methods for Calculating Trend Slope
One of the standout features of this Pine Script indicator is its ability to calculate trend slopes using three different methods: Linear Regression, Standard Deviation, and ATR (Average True Range).
- Linear Regression: This method calculates the best-fit line based on past price data, helping to predict the overall trend direction. It’s widely used because it adapts to changing market conditions and offers a statistical view of the trend’s strength.
- Standard Deviation: Standard deviation measures how much price action deviates from the mean. It can be particularly useful for identifying periods of high volatility and trend strength. A larger standard deviation typically suggests stronger trends.
- Average True Range (ATR): ATR measures market volatility and is used to determine the range of price movement. By incorporating ATR, the indicator can adjust the trendlines and signals based on price fluctuations, making it particularly useful in volatile market conditions.
3. Breakout and Breakdown Signals
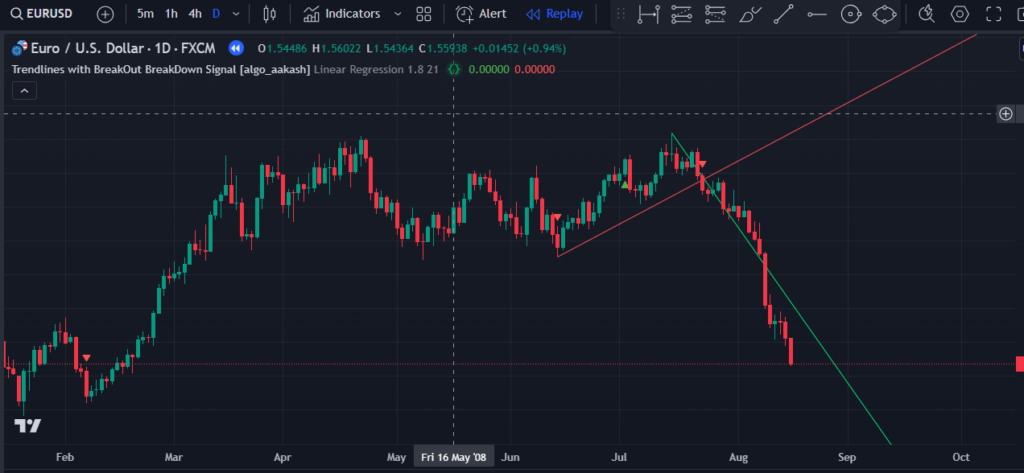
The Pine Script indicator also includes a feature that identifies breakouts and breakdowns. These are critical price movements when the price breaks above or below the established trendline. The indicator plots small triangle shapes (often green for upward breakouts and red for downward breakdowns) to indicate when the price crosses the trendline.
- Breakout Signal: When the price moves above the upward trendline, it is considered a breakout. This often signals the start of a new bullish trend.
- Breakdown Signal: Conversely, when the price moves below the downward trendline, it triggers a breakdown. This suggests the possibility of a bearish move in the market.
These signals help traders identify potential entry points for trades. For example, if the price breaks above the trendline, traders might consider entering a long position, while a breakdown below the trendline might prompt them to enter a short position.
4. Customizable Colors
The indicator allows traders to customize the colors of the trendlines. For example, users can change the lime green color of upward trendlines to any color they prefer to match their charting style. This makes the indicator highly customizable and adaptable to personal preferences, creating a more personalized and visually appealing trading experience.
How Does the Trendline Breakout Breakdown Indicator Work on TradingView?
To use this Pine Script Trendline Indicator on TradingView, follow these steps:
- Open TradingView: Go to the TradingView website or app and log in to your account.
- Access Pine Script: On your chart, click on the “Pine Editor” tab located at the bottom of your screen.
- Paste the Script: Copy the Pine Script code for the Trendline Indicator and paste it into the Pine Editor.
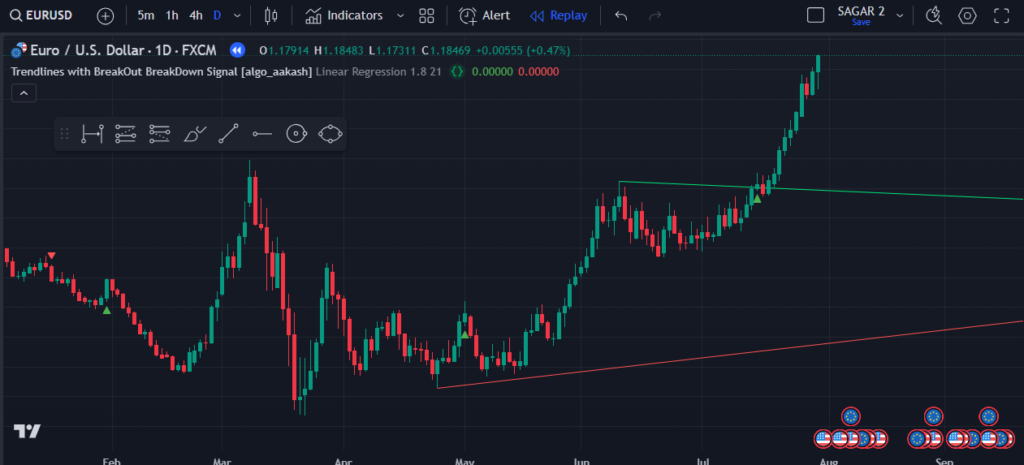
- Add the Indicator: Click on “Add to Chart” to apply the indicator to your chart. The upward and downward trendlines will automatically appear, and breakout or breakdown signals will be displayed as small triangle shapes.
- Adjust Settings: You can customize the trendline colors and select the method for calculating the trend slope. Depending on your preference and market conditions, you might choose Linear Regression for smoother trends, Standard Deviation for more volatile conditions, or ATR for adjustable trendlines based on market volatility.
- Interpret the Signals: Watch for breakout or breakdown signals, and use these as potential entry or exit points for your trades.
Why Should You Use This Indicator?
Using the Trendline Indicator on TradingView offers numerous benefits, such as:
- Automation: The indicator automatically detects and plots trendlines, saving you time and effort.
- Multiple Slope Calculation Methods: The three different methods for calculating trend slope allow you to choose the best one for the current market condition, increasing your chances of accurate trend analysis.
- Customizable: The ability to change colors and settings makes the indicator highly customizable to fit your trading style.
- Breakout/Breakdown Alerts: The breakout and breakdown signals can help you catch significant price movements, offering potential trade opportunities.
Conclusion
The Pine Script Trendline Indicator on TradingView is a powerful tool for detecting trends and breakouts. It automatically draws trendlines, calculates trend slopes using three different methods, and provides valuable breakout and breakdown signals. By using this indicator, traders can simplify their analysis and make more informed decisions, leading to better trading outcomes.
Whether you’re a beginner or an experienced trader, incorporating this indicator into your TradingView setup can enhance your technical analysis and improve your trading strategy. With its customizable features and multiple methods for trend analysis, this Pine Script indicator is a must-have tool for traders looking to stay ahead of the market.
Pinescript of Trendline Breakout Breakdown TradingView Indicator
Get this exclusive indicator now! Contact us at +91 7620658346. We specialize in creating custom TradingView indicators, MT4/MT5 strategies, and trading bots.
Stay updated by following us on Instagram, YouTube, and Twitter: @algo_aakash!
Disclaimer
The information provided in this article and any associated indicators is for educational purposes only. Trading financial markets involves a high level of risk, and there is no guarantee of profit. The custom Bollinger Band strategy is based on historical data and technical analysis, which may not predict future market conditions. Users should perform their own research, assess their risk tolerance, and consult a licensed financial advisor before making any trading decisions. The author and developer of this indicator are not responsible for any losses incurred from using this strategy. Please trade responsibly.
Click here to interact with the feature.
🔓 Get This Tool for FREE!
- ✅ Click here to open a trading account using our referral link and start trading.
- 💡 Use coupon code: FREE during checkout.
- 📅 After 7 days of active trading under our referral link, you’ll get access to this tool in your account.
- ⚠️ Keep trading to keep access free — if you're inactive for 7 days, your access will be removed.
- 👉 Already have an account? You can change the IB (introducing broker) to our referral link and still qualify!

0 Comments