🔓 Get All Tools for FREE!
- ✅ Click here to open a trading account using our referral link and start trading.
- 📅 After 7 days of active trading under our referral link, you can get access to all tools in your account.
- ⚠️ Keep trading to keep access free — if you're inactive for 7 days, your access will be removed.
- 👉 Already have an account? You can change the IB (introducing broker) to our referral link ( https://one.exnesstrack.org/a/w7syl3vnjb ) and still qualify!
The trading world thrives on precision, timing, and understanding critical price levels. One of the most powerful methods to interpret market sentiment and potential price movements lies in support and resistance analysis. Recognizing this, I developed a TradingView indicator using Pine Script to make trading these levels simpler and more actionable. This custom indicator is designed to identify support and resistance breakouts and retests, helping traders make confident, timely decisions.
Why Support and Resistance Levels Matter in Trading
Support and resistance levels serve as essential building blocks of technical analysis. These levels reflect price points where market participants have historically shown strong buying or selling interest. When prices approach these levels, the market often responds with either a continuation of the current trend or a reversal.
🔓 Get All Tools for FREE!
- ✅ Click here to open a trading account using our referral link and start trading.
- 📅 After 7 days of active trading under our referral link, you can get access to all tools in your account.
- ⚠️ Keep trading to keep access free — if you're inactive for 7 days, your access will be removed.
- 👉 Already have an account? You can change the IB (introducing broker) to our referral link ( https://one.exnesstrack.org/a/w7syl3vnjb ) and still qualify!
- Support Level: This is a price point where demand has previously outweighed supply, causing a price increase. When the price approaches support, traders anticipate a bounce-back unless there is significant selling pressure to break it.
- Resistance Level: This is the opposite of support, where supply has historically exceeded demand, pushing the price down. As prices approach resistance, sellers tend to step in, but if buying pressure is strong enough, a breakout could occur.
In trading, breakouts and retests at these levels are significant. A breakout indicates a shift in momentum, while a retest suggests that the market may be validating a new level as support or resistance. By automating this analysis with the Support & Resistance Breakout Retest Indicator, you can stay a step ahead in anticipating key market moves.
What is the Support & Resistance Breakout Retest Indicator?
This custom TradingView indicator is programmed in Pine Script to accurately detect breakouts and retests of support and resistance levels, providing real-time trading signals. It aims to enhance your trading by pinpointing critical areas where price action breaks through or reverses. This simplifies your trading decisions and improves accuracy. Having worked with over 200+ clients and developed 500+ strategies across forex, crypto, and stock markets, I’ve distilled key insights into this tool to ensure it addresses real-world trading needs.
Key Features of the Indicator:
- Automatic Level Detection: It identifies significant support and resistance levels on the chart without the need for manual drawing.
- Real-Time Breakout Alerts: It notifies you when price action breaks above resistance or below support.
- Retest Signals: Alerts when the price returns to test the previous breakout level, providing clarity on whether it holds as a new support or resistance.
- Customizable Inputs: You can adjust settings for different market conditions, timeframe, and personal trading style.
How the Indicator Works: A Step-by-Step Breakdown
This indicator leverages historical price data to identify potential support and resistance levels. It then monitors the price action to determine whether these levels are breached or retested, generating actionable signals.
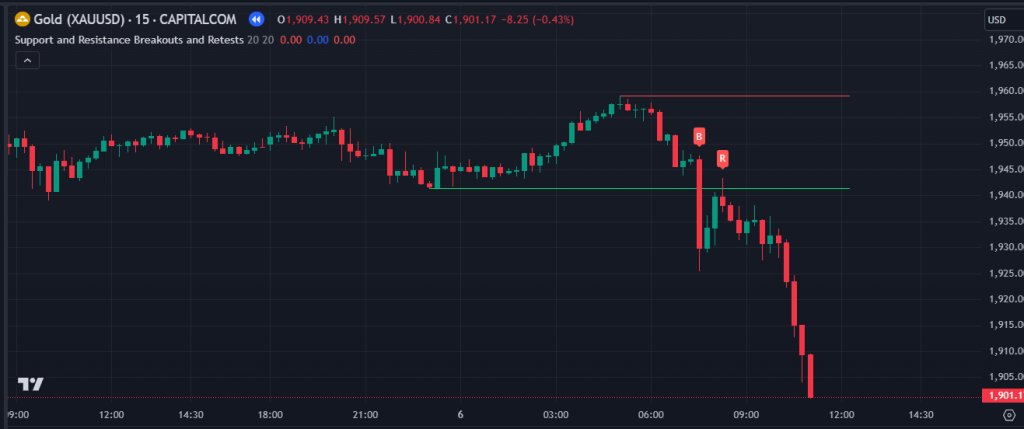
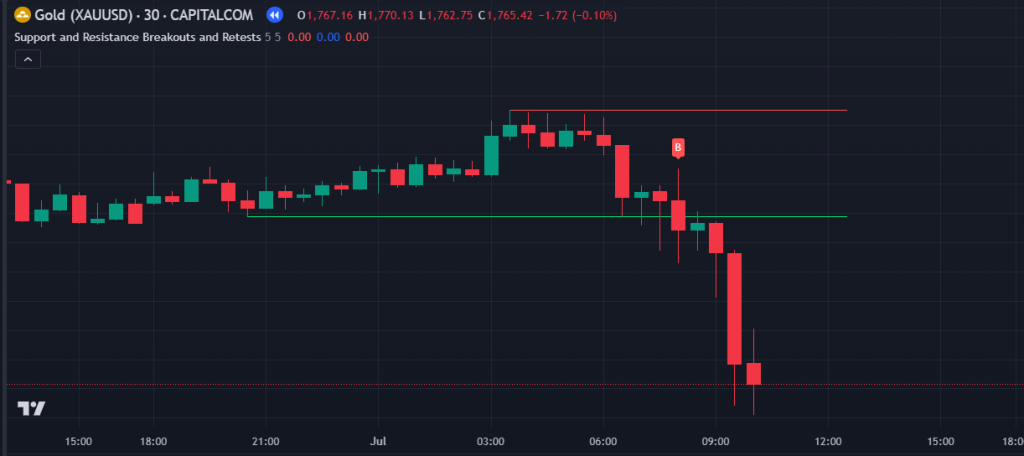
- Breakout Signal: A breakout occurs when a candle closes above a resistance level. This event typically signals that buyers have overwhelmed sellers, suggesting potential upward momentum.
- Retest of Resistance as Support: Once a breakout happens, the price often returns to test the previous resistance, which now acts as support. If the price holds at this level, the indicator generates a retest signal, confirming the breakout’s validity.
- Support Breakdown Signal: When price action closes below a support level, it generates a breakdown signal. This suggests that selling pressure has intensified, pushing the price lower.
- Retest of Support as Resistance: Following a breakdown, the price may rise back to the previous support, now acting as resistance. If the price holds below this level, a retest signal is issued, reinforcing the breakdown.
By capturing these critical market movements, this indicator helps traders make informed entry and exit decisions, minimizing guesswork and enhancing accuracy in trend identification.
Benefits of Using the Support & Resistance Breakout Retest Indicator
This TradingView indicator offers several advantages to traders, whether they are beginners or seasoned professionals:
- Enhanced Decision-Making: By providing clear signals for breakouts and retests, the indicator helps traders make informed decisions based on market structure.
- Reduced Emotional Bias: Since it offers objective signals, traders can avoid emotional trading mistakes that arise from overthinking support and resistance levels.
- Adaptable to Multiple Markets: The indicator is versatile and can be used across forex, crypto, and stock markets. It’s suitable for day trading, swing trading, and long-term investing.
- Saves Time: With automatic level detection and real-time alerts, you won’t need to constantly monitor charts, allowing you to focus on other important aspects of your strategy.
How to Use the Support & Resistance Breakout Retest Indicator in TradingView
To get the best out of this indicator, follow these steps to set it up and interpret the signals effectively:
- Add the Indicator: On TradingView, add the custom indicator by searching its name in the ‘Indicators’ tab or inputting its script directly if you have custom access.
- Select the Desired Timeframe: Choose a timeframe that aligns with your trading style (e.g., 5-minute for day trading, daily for swing trading).
- Adjust the Settings: Customize the indicator inputs to suit your preferences, such as breakout thresholds or sensitivity to price movements.
- Interpret the Signals:
- Breakout Signal: A green arrow or icon may appear above the resistance level if price action breaks out.
- Retest Confirmation: When price returns to test the previous breakout level, you may see another confirmation signal.
- Breakdown Signal: A red arrow or symbol could indicate a support breakdown.
- Retest of Support as Resistance: Similar to the breakout, a retest confirmation will appear if the previous support is tested as resistance.
- Implement in Your Trading Plan: Combine these signals with other analysis techniques or indicators for a robust trading approach. Confirm signals using volume, RSI, or trend-based indicators for optimal results.
Example Use Case in Trading
Let’s look at a practical example using this indicator. Imagine you’re monitoring a stock where the price has been consistently hitting resistance at $100. Once the indicator signals a breakout at $101, you receive an alert. The stock pulls back to $100, where the indicator signals a retest, confirming $100 as new support. This setup provides a low-risk entry point with a defined stop-loss below $100, allowing you to ride the upward trend.
Frequently Asked Questions (FAQs)
- What markets can I use this indicator in?
- You can use this indicator in forex, crypto, and stock markets. It’s versatile across different trading environments.
- Can I adjust the sensitivity of breakout and retest signals?
- Yes, the indicator offers customizable settings, allowing you to define parameters that best suit your trading style.
- How does it differ from a standard support and resistance indicator?
- This indicator provides additional clarity with retest signals, enabling traders to confirm breakouts and breakdowns instead of relying solely on static levels.
Contact us at +91 7620658346 for access to this indicator. We offer algo development for TradingView indicators, MT4/MT5, and trading bots.
Follow us on Instagram, YouTube, and Twitter @algo_aakash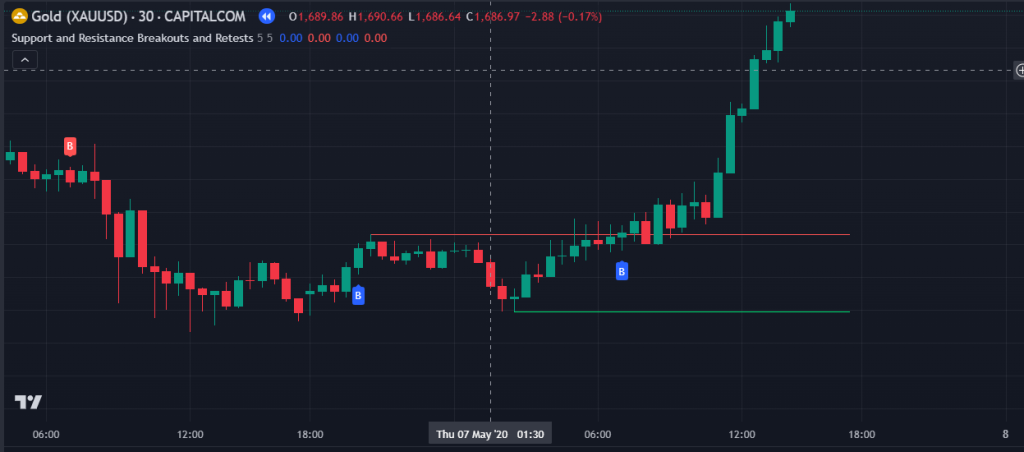
Conclusion
The Support & Resistance Breakout Retest Indicator on TradingView is a powerful tool for traders looking to enhance their trading accuracy. By identifying critical price points and providing actionable breakout and retest signals, it takes the guesswork out of support and resistance analysis. Designed with insights gathered from extensive trading experience, this indicator not only saves time but also boosts your trading confidence by delivering clear, data-backed signals. Give it a try in your next trading session, and watch how it can help elevate your trading strategy to the next level!
Disclaimer:
The content provided here is for informational and educational purposes only. It is not intended as financial advice, nor does it constitute an offer, solicitation, or recommendation to buy or sell any securities, currencies, or other financial products. Trading involves significant risk, and past performance is not indicative of future results. Always perform your own due diligence, consider your financial goals and risk tolerance, and consult with a licensed financial advisor before making any trading decisions. The use of any trading indicators or strategies should be done with caution and at your own risk.
0 Comments