🔓 Get All Tools for FREE!
- ✅ Click here to open a trading account using our referral link and start trading.
- 📅 After 7 days of active trading under our referral link, you can get access to all tools in your account.
- ⚠️ Keep trading to keep access free — if you're inactive for 7 days, your access will be removed.
- 👉 Already have an account? You can change the IB (introducing broker) to our referral link ( https://one.exnesstrack.org/a/w7syl3vnjb ) and still qualify!
Trading can often feel overwhelming, especially when it comes to identifying key support and resistance levels and knowing when to act on them. Many traders miss out on excellent opportunities simply because they don’t have the right tools to detect breakout and retest levels with precision. To help address this, I’ve developed a powerful yet easy-to-use tool: the Support & Resistance Breakout Retest Indicator. This TradingView indicator, built using Pinescript, is designed to streamline your trading process, allowing you to make informed decisions faster.
In this article, I’ll guide you through what the indicator does, how it works, and how you can use it to enhance your trading strategy.
🔓 Get All Tools for FREE!
- ✅ Click here to open a trading account using our referral link and start trading.
- 📅 After 7 days of active trading under our referral link, you can get access to all tools in your account.
- ⚠️ Keep trading to keep access free — if you're inactive for 7 days, your access will be removed.
- 👉 Already have an account? You can change the IB (introducing broker) to our referral link ( https://one.exnesstrack.org/a/w7syl3vnjb ) and still qualify!
What is the Support & Resistance Breakout Retest Indicator?
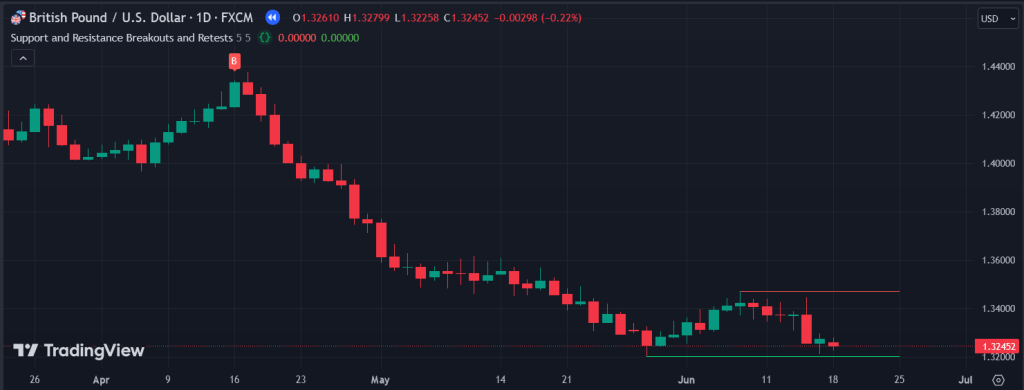
The Support & Resistance Breakout Retest Indicator is a custom-built tool that automatically identifies key breakout and retest points on a TradingView chart. It takes the guesswork out of trading by visually marking important price levels where the market breaks through support or resistance, and then signaling when these levels are retested.
In simpler terms, it helps you see when the market is breaking out of a critical price zone and gives you a heads-up when the price comes back to test that zone again. This process can often lead to significant trading opportunities because retests tend to either confirm the strength of a breakout or indicate that the market may reverse.
Whether you trade in stocks, forex, or cryptocurrencies, this indicator adapts to your chart and market, providing valuable insights into price action. No matter what your preferred trading style is—whether it’s day trading, swing trading, or position trading—understanding support and resistance dynamics is fundamental, and this indicator simplifies that process for you.
Why Support and Resistance Matter in Trading?
Before diving into how the indicator works, it’s important to understand why support and resistance are crucial in trading. In any financial market, support refers to a price level where demand is strong enough to prevent the price from falling further. On the flip side, resistance is a price level where selling pressure outweighs buying pressure, preventing the price from rising.
These levels act like barriers that the price has to either break through or bounce back from. A breakout happens when the price successfully crosses these barriers, signaling strong momentum in a particular direction. A retest occurs when the price revisits these levels, often to confirm the breakout’s validity or to reverse direction.
Knowing when these breakouts and retests occur can help you make better trading decisions. That’s exactly where this indicator shines.
How Does the Support & Resistance Breakout Retest Indicator Work?
This indicator operates on the principle of price action. It scans for levels where a price breakout happens and automatically marks them on the chart. After the breakout, it keeps an eye on the price to detect when it revisits these areas for a retest. Here’s a more detailed breakdown of how it works:
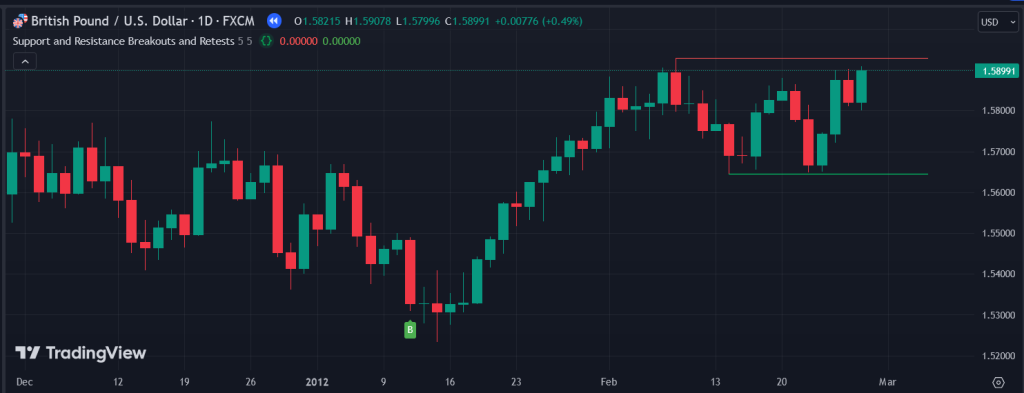
- Breakout Detection:
- When the price closes above a resistance level, the indicator generates a breakout signal.
- Similarly, when the price closes below a support level, it triggers a breakdown signal.
- These signals provide you with real-time alerts about market momentum and shifts, allowing you to act quickly.
- Retest Identification:
- After the breakout, if the price returns to the previous resistance level (which now acts as support), the indicator flags a retest signal.
- In the case of a breakdown, the price revisits the previous support level, now acting as resistance, and the indicator gives another retest signal.
- Visual Cues:
- The indicator provides clear visual markers on the chart, making it easy to see when a breakout or retest is happening.
- It eliminates confusion and keeps the chart clean while highlighting important price levels.
- Customizable Alerts:
- To ensure you don’t miss any opportunities, you can set up alerts through TradingView to notify you when a breakout or retest signal is triggered. This allows you to stay on top of the market without having to constantly monitor the charts.
How to Use This Indicator in TradingView?
Now that you understand how the indicator works, here’s a step-by-step guide on how to use it effectively on your TradingView charts:
- Install the Indicator:
- First, navigate to the TradingView platform, open the chart of the asset you want to trade, and add the Support & Resistance Breakout Retest Indicator.
- You can find this indicator in the public library or access it directly through a custom script (if provided).
- Identify Breakouts and Retests:
- As soon as the indicator detects a breakout (a candle closing above resistance or below support), you’ll see a visual cue on the chart.
- Wait for a retest signal, which is indicated when the price revisits the breakout level.
- Set Your Trade:
- Once a retest signal is triggered, it gives you a potential entry point.
- If the price bounces off the level and resumes in the direction of the breakout, this could be a signal to enter the trade.
- Stop Loss and Take Profit:
- Use the breakout and retest levels as part of your risk management strategy. Place your stop-loss just below the retested level (for long positions) or above (for short positions).
- For take-profit levels, you can use additional technical analysis or support/resistance zones to identify where to exit.
- Backtest the Indicator:
- To get comfortable with the indicator, backtest it on historical data. Analyze how it performed during past breakout and retest scenarios to refine your strategy further.
Benefits of Using the Support & Resistance Breakout Retest Indicator
- Simplifies Analysis:
- One of the main benefits of this indicator is how it simplifies the analysis of support and resistance levels. Rather than manually identifying breakouts and retests, the indicator does it for you, saving you time and effort.
- Real-Time Alerts:
- You’ll receive instant alerts when significant price actions occur, allowing you to capitalize on trading opportunities without the need to constantly monitor your charts.
- Adapts to Any Market:
- Whether you’re trading stocks, forex, or crypto, this indicator works across all markets, making it a versatile tool for any trader.
- Enhances Accuracy:
- By automatically marking breakout and retest points, the indicator reduces human error and ensures you don’t miss important trading opportunities.
Contact us at +91 7620658346 for access to this indicator. We offer algo development for TradingView indicators, MT4/MT5, and trading bots. Follow us on Instagram, YouTube, and Twitter @algo_aakash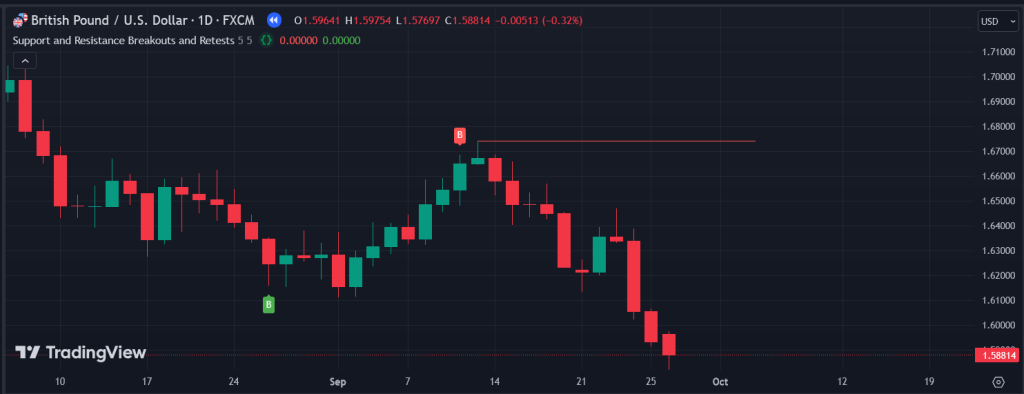
Conclusion
The Support & Resistance Breakout Retest Indicator is a must-have tool for any trader looking to improve their trading strategy. It simplifies the process of identifying key price levels, enhances accuracy, and provides real-time alerts that allow you to act on breakouts and retests with confidence. Whether you’re a beginner or an experienced trader, this indicator can help you make smarter, more informed trading decisions.
Disclaimer:
The information provided in this article, including the description of the Support & Resistance Breakout Retest Indicator, is for educational and informational purposes only. It should not be considered as financial advice or a recommendation to trade any particular asset or strategy. Trading in financial markets involves significant risk and may not be suitable for all investors. Past performance does not guarantee future results. Always do your own research and consult with a professional financial advisor before making any investment or trading decisions. The use of this indicator is at your own risk.
Click here to interact with the feature.
🔓 Get This Tool for FREE!
- ✅ Click here to open a trading account using our referral link and start trading.
- 💡 Use coupon code: FREE during checkout.
- 📅 After 7 days of active trading under our referral link, you’ll get access to this tool in your account.
- ⚠️ Keep trading to keep access free — if you're inactive for 7 days, your access will be removed.
- 👉 Already have an account? You can change the IB (introducing broker) to our referral link and still qualify!

0 Comments