🔓 Get All Tools for FREE!
- ✅ Click here to open a trading account using our referral link and start trading.
- 📅 After 7 days of active trading under our referral link, you can get access to all tools in your account.
- ⚠️ Keep trading to keep access free — if you're inactive for 7 days, your access will be removed.
- 👉 Already have an account? You can change the IB (introducing broker) to our referral link ( https://one.exnesstrack.org/a/w7syl3vnjb ) and still qualify!
In the fast-paced world of financial markets, understanding the trend of different sectors can be a crucial factor in making informed trading decisions. The Sector Trend Tracker (EMA 200) indicator, a custom-built TradingView tool, provides traders with a comprehensive view of sector performance based on the widely used 200-period Exponential Moving Average (EMA). This article will explore how this indicator works, why it’s valuable for traders, and how you can incorporate it into your trading strategy for better results.
What is the Sector Trend Tracker (EMA 200)?
The Sector Trend Tracker (EMA 200) is a powerful and intuitive TradingView indicator designed to monitor the trends of multiple market sectors simultaneously. It works by analyzing the 200-period EMA for a set of chosen sectors, such as IT, Banking, Nifty Junior, India VIX, and Financial Services. The 200 EMA is a popular tool in technical analysis because it smooths out price action and helps traders identify long-term trends.
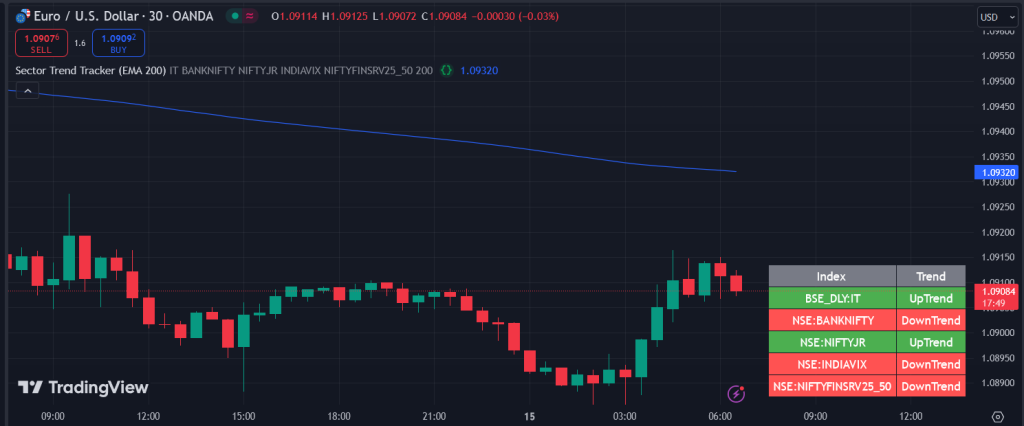
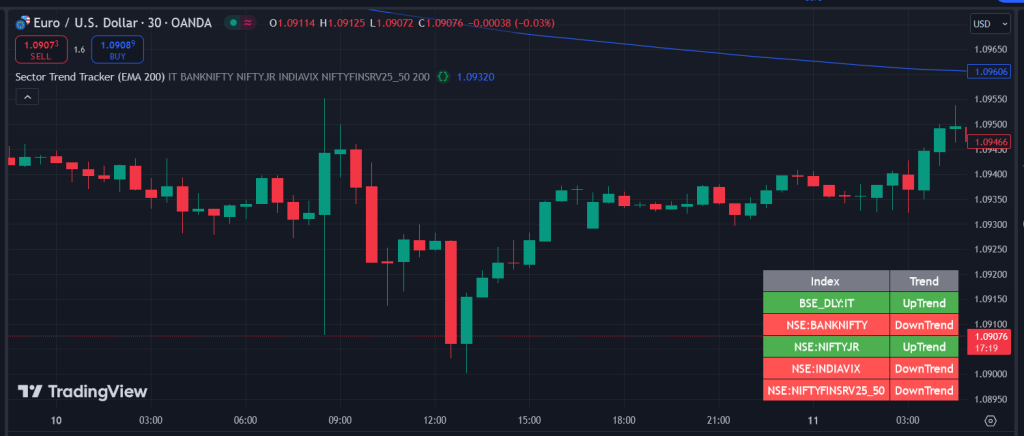
By applying the 200 EMA to these sectors, the indicator provides real-time data about whether a particular sector is in an uptrend or a downtrend. The key feature of this indicator is its ability to present this information in a color-coded table on your chart, making it easy to grasp sector performance at a glance.
🔓 Get All Tools for FREE!
- ✅ Click here to open a trading account using our referral link and start trading.
- 📅 After 7 days of active trading under our referral link, you can get access to all tools in your account.
- ⚠️ Keep trading to keep access free — if you're inactive for 7 days, your access will be removed.
- 👉 Already have an account? You can change the IB (introducing broker) to our referral link ( https://one.exnesstrack.org/a/w7syl3vnjb ) and still qualify!
Why Use the 200 EMA?
The 200-period Exponential Moving Average (EMA) is often considered a crucial indicator in both short-term and long-term trading strategies. Here’s why:
- Trend Confirmation: The 200 EMA helps traders confirm the prevailing trend of a market. When the price stays above the 200 EMA, it suggests an uptrend, while the price below the 200 EMA signals a downtrend. This trend-following technique can be highly effective in gauging long-term market direction.
- Support and Resistance: The 200 EMA also acts as dynamic support or resistance. In an uptrend, it often serves as a strong support level where prices might rebound after a pullback. Conversely, in a downtrend, it acts as a resistance level where the price may struggle to break above.
- Widely Accepted: The 200 EMA is widely used by retail traders, institutional traders, and algorithmic systems alike. Its broad acceptance makes it a reliable indicator for analyzing market trends across different asset classes.
How the Sector Trend Tracker (EMA 200) Works
The Sector Trend Tracker (EMA 200) simplifies the process of analyzing multiple sectors by consolidating all trend information into one convenient table. Here’s a detailed look at how this indicator operates:
- Input Sectors: The indicator allows you to input up to five sector symbols. These could be major indices like BSE:IT, BANKNIFTY, NIFTY Junior, or other key financial or volatility indicators like INDIAVIX.
- EMA Calculation: For each of the selected sectors, the indicator calculates the 200-period EMA. This calculation is based on the sector’s closing prices over the selected time frame.
- Trend Identification: The indicator compares the current closing price with the 200 EMA for each sector. If the closing price is above the EMA, the sector is considered to be in an uptrend. If the closing price is below the EMA, the sector is in a downtrend.
- Visual Representation: The results of the trend analysis are displayed in a neat table on your chart. Each sector is listed with its corresponding trend (UpTrend or DownTrend). The table cells are color-coded — green for uptrends and red for downtrends — making it quick and easy to interpret.
How to Use the Sector Trend Tracker (EMA 200) in TradingView
Incorporating the Sector Trend Tracker (EMA 200) into your TradingView chart is a seamless process. Once you’ve added the indicator, it will immediately start tracking your selected sectors and displaying their trends. Here’s a step-by-step guide to help you set it up:
- Choose Your Sectors: The first step is selecting the five sectors you want to monitor. The indicator is pre-configured to track sectors like BSE:IT and BANKNIFTY, but you can customize this to match your trading interests.
- Set the Time Frame: Since the 200 EMA is a long-term trend indicator, it’s recommended to use higher time frames such as daily, weekly, or monthly charts. However, you can adjust this depending on your trading strategy.
- Analyze the Trends: The table on the chart will automatically update based on the current price data. If a sector shows a green cell with the label “UpTrend,” it indicates that the sector’s closing price is above its 200 EMA, signaling bullish conditions. Conversely, a red cell with the label “DownTrend” indicates that the sector is trading below its 200 EMA, which suggests bearish momentum.
- Use in Conjunction with Other Indicators: While the Sector Trend Tracker (EMA 200) is powerful on its own, you can combine it with other technical indicators such as the Relative Strength Index (RSI), MACD, or Bollinger Bands to fine-tune your strategy and get better entry and exit points.
Benefits of the Sector Trend Tracker (EMA 200)
There are several reasons why the Sector Trend Tracker (EMA 200) can be an essential tool for both novice and experienced traders:
- Quick Overview of Multiple Sectors: By consolidating the trend status of up to five sectors in one table, the indicator saves you time and effort. Instead of checking each sector individually, you can get a complete overview in seconds.
- Improved Decision Making: Knowing the trend direction of multiple sectors helps you make informed decisions. For example, if all sectors are in an uptrend, it might signal a broader market rally. Conversely, widespread downtrends could suggest caution or even bearish market conditions.
- Customizable: The indicator allows you to choose which sectors to track, giving you flexibility based on your trading preferences and market focus.
- Visually Intuitive: The color-coded table makes it easy to interpret trends. With green for uptrends and red for downtrends, you can quickly assess the market situation without needing to delve into complex data.
Contact us at +91 7620658346 for access to this indicator. We offer algo development for TradingView indicators, MT4/MT5, and trading bots. Follow us on Instagram, YouTube, and Twitter @algo_aakash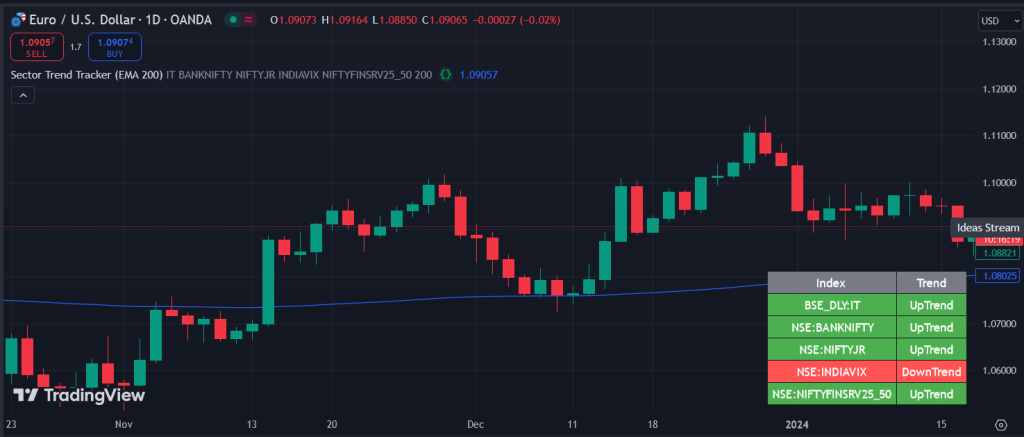
Conclusion
The Sector Trend Tracker (EMA 200) is an indispensable tool for traders looking to track the performance of various market sectors efficiently. By leveraging the power of the 200-period EMA, it provides clear, color-coded signals that help traders identify whether sectors are in bullish or bearish trends. Whether you’re a long-term investor or a swing trader, incorporating this indicator into your TradingView chart can streamline your analysis process and help you make better trading decisions.
Disclaimer: The content provided in this article, including the Sector Trend Tracker (EMA 200) indicator, is for informational and educational purposes only. It should not be construed as financial, investment, or trading advice. Trading in financial markets carries significant risk, and it is possible to lose more than your initial investment. Always conduct thorough research and consult with a certified financial advisor or professional before making any trading or investment decisions. Past performance is not indicative of future results. The author and publisher of this content are not liable for any financial losses incurred through the use of the information provided.

0 Comments