🔓 Get All Tools for FREE!
- ✅ Click here to open a trading account using our referral link and start trading.
- 📅 After 7 days of active trading under our referral link, you can get access to all tools in your account.
- ⚠️ Keep trading to keep access free — if you're inactive for 7 days, your access will be removed.
- 👉 Already have an account? You can change the IB (introducing broker) to our referral link ( https://one.exnesstrack.org/a/w7syl3vnjb ) and still qualify!
Trading in the financial markets requires a solid understanding of various technical indicators, and one of the most powerful tools at your disposal is the Moving Average Convergence Divergence (MACD). In this guide, we will explore the Custom MACD Indicator, its functionality, and how to effectively utilize it in TradingView to enhance your trading strategies.
What is the Custom MACD Indicator?
The Custom MACD indicator is a momentum oscillator that plays a crucial role in helping traders identify potential trends and reversals in price movements. This indicator is composed of three key elements:
- MACD Line: This line is derived from the difference between two exponential moving averages (EMAs) of an asset’s price. Typically, the 12-period EMA and the 26-period EMA are used. The MACD line reflects the momentum of price movements.
- Signal Line: This is a smoothed average of the MACD line, usually calculated over a 9-period EMA. The signal line helps to identify the entry and exit points based on the crossovers with the MACD line.
- Histogram: The histogram represents the difference between the MACD line and the signal line, providing a visual representation of momentum. When the histogram is positive, it indicates that the MACD line is above the signal line, suggesting bullish momentum. Conversely, when the histogram is negative, it indicates bearish momentum.
The Custom MACD is widely used in trading because it helps traders determine market momentum and potential entry or exit points. Its effectiveness lies in its ability to provide both trend-following and momentum-based signals.
🔓 Get All Tools for FREE!
- ✅ Click here to open a trading account using our referral link and start trading.
- 📅 After 7 days of active trading under our referral link, you can get access to all tools in your account.
- ⚠️ Keep trading to keep access free — if you're inactive for 7 days, your access will be removed.
- 👉 Already have an account? You can change the IB (introducing broker) to our referral link ( https://one.exnesstrack.org/a/w7syl3vnjb ) and still qualify!

How Does the Custom MACD Indicator Work?
The Custom MACD strategy operates on two primary principles: crossovers and divergences.
1. Crossovers
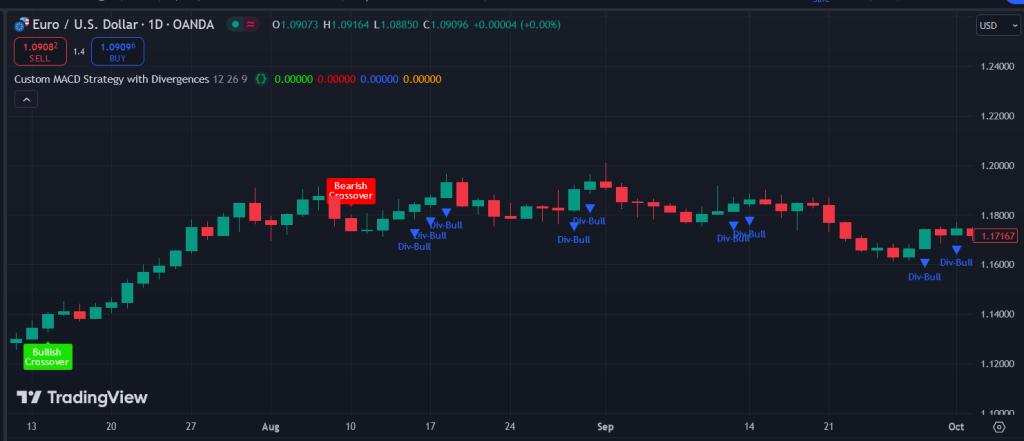
- Bullish Crossover: When the MACD line crosses above the signal line, it generates a bullish signal. This indicates increasing upward momentum, suggesting it may be a good time to enter a long (buy) position. Traders often look for additional confirmation from other indicators or chart patterns to validate the signal.
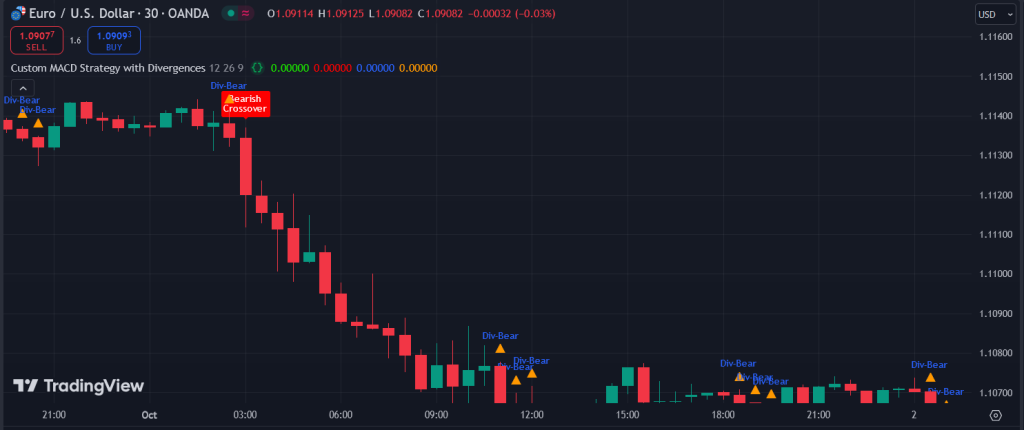
- Bearish Crossover: Conversely, when the MACD line crosses below the signal line, it produces a bearish signal. This indicates increasing downward momentum, suggesting a potential opportunity to sell or short the asset. Again, traders often seek confirmation from other indicators before acting on this signal.
2. Divergences
Divergences occur when the price of an asset moves in one direction while the MACD line moves in the opposite direction. This can signal potential trend reversals.
- Bullish Divergence: This occurs when the price makes a lower low while the MACD makes a higher low, indicating a potential reversal from a downtrend to an uptrend.
- Bearish Divergence: This happens when the price makes a higher high while the MACD makes a lower high, suggesting a possible reversal from an uptrend to a downtrend.
Detecting divergences can be a powerful tool for traders, as it often signals shifts in market momentum before they are reflected in price movements.
How to Use the Custom MACD Indicator in TradingView
Now that you understand what the Custom MACD Indicator is and how it works, let’s explore how to use it effectively on TradingView, a popular platform for charting and analysis.
Step-by-Step Guide to Using the Custom MACD Indicator
- Open TradingView: Navigate to the TradingView website and log in or create an account if you don’t have one. Choose the asset you want to analyze.
- Add the Custom MACD Indicator: Click on the Indicators button at the top of the chart. In the search bar, type “Custom MACD” and select it from the list. The indicator will be added to your chart.
- Observe Crossovers:
- Bullish Crossover: Look for instances when the blue MACD line crosses above the red signal line. This is your cue to consider entering a long position. Ensure you check other indicators for confirmation.
- Bearish Crossover: Conversely, when the MACD line crosses below the signal line, it’s a signal to consider selling or shorting the asset.
- Check for Divergences: While monitoring the MACD, look for instances of divergences:
- If the price is making lower lows while the MACD is making higher lows, prepare for a potential bullish reversal.
- If the price is making higher highs while the MACD is making lower highs, anticipate a potential bearish reversal.
- Customize Settings: Tailor the MACD settings to fit your trading style. You can adjust the periods of the EMAs used in the MACD calculation to be more or less sensitive to price movements. However, always prioritize risk management.
Risk Management
No trading strategy is complete without a solid risk management plan. Ensure you set stop-loss orders to protect your capital and consider using position sizing techniques to limit your exposure based on your trading account size.
Pinescript code for "Custom MACD Indicator"

//@version=5
// insta id algo_aakash
indicator("Custom MACD Strategy with Divergences", overlay=true)

// MACD parameters
fastLength = input(12, title="MACD Fast Length")
slowLength = input(26, title="MACD Slow Length")
signalSmoothing = input(9, title="Signal Smoothing")

// Calculate MACD values
[macdLine, signalLine, _] = ta.macd(close, fastLength, slowLength, signalSmoothing)
histogram = macdLine - signalLine

// Plotting the MACD and Signal lines
// plot(macdLine, color=color.blue, title="MACD Line")
// plot(signalLine, color=color.red, title="Signal Line")
// plot(histogram, style=plot.style_columns, color=(histogram >= 0 ? color.green : color.red), title="MACD Histogram")

// Crossover detection
bullishCross = ta.crossover(macdLine, signalLine)
bearishCross = ta.crossunder(macdLine, signalLine)

// Plot signals on crossover
// plotshape(bullishCross, title="Bullish Crossover", location=location.belowbar, color=color.green, style=shape.labelup, text="BUY")
// plotshape(bearishCross, title="Bearish Crossover", location=location.abovebar, color=color.red, style=shape.labeldown, text="SELL")
plotshape(bullishCross, style=shape.labelup, location=location.belowbar, color=#1be100, size=size.tiny, title='Bullish Crossover', text='Bullish '+'\n'+ 'Crossover', textcolor=color.white)
plotshape( bearishCross, style=shape.labeldown, location=location.abovebar, color=#fc0000, size=size.tiny, title='Bearish Crossover', text='Bearish '+'\n'+ 'Crossover', textcolor=color.white)


// Divergence detection (basic)
priceHigherHigh = ta.highest(close, 5)[1] < close
macdLowerHigh = ta.highest(macdLine, 5)[1] > macdLine
bullishDivergence = priceHigherHigh and macdLowerHigh

priceLowerLow = ta.lowest(close, 5)[1] > close
macdHigherLow = ta.lowest(macdLine, 5)[1] < macdLine
bearishDivergence = priceLowerLow and macdHigherLow

// Plot divergence signals
plotshape(bullishDivergence, title="Bullish Divergence", location=location.belowbar, color=color.blue, style=shape.triangledown, text="Div-Bull")
plotshape(bearishDivergence, title="Bearish Divergence", location=location.abovebar, color=color.orange, style=shape.triangleup, text="Div-Bear")
// plotshape(bullishDivergence, style=shape.labelup, location=location.belowbar, color=#1be100, size=size.tiny, title='Buy', text='Buy', textcolor=color.white)
// plotshape( bearishDivergence, style=shape.labeldown, location=location.abovebar, color=#fc0000, size=size.tiny, title='Sell', text='Sell', textcolor=color.white)

// Alert conditions
alertcondition(bullishCross, title="Bullish MACD Crossover", message="MACD Bullish Crossover")
alertcondition(bearishCross, title="Bearish MACD Crossover", message="MACD Bearish Crossover")
alertcondition(bullishDivergence, title="Bullish Divergence", message="Bullish Divergence Detected")
alertcondition(bearishDivergence, title="Bearish Divergence", message="Bearish Divergence Detected")
Conclusion
The Custom MACD Indicator is an essential tool for traders looking to enhance their market analysis and decision-making. By understanding its components and functionality, you can effectively identify trends and potential reversals in price movements. Whether you are a beginner or an experienced trader, incorporating the Custom MACD into your trading strategy on TradingView can significantly improve your trading outcomes.
Disclaimer
The content provided in this article is for informational and educational purposes only and should not be considered financial advice. Trading in financial markets involves a high level of risk and may not be suitable for all investors. Past performance is not indicative of future results, and there is no guarantee that any trading strategy will be successful.
🔓 Get This Tool for FREE!
- ✅ Click here to open a trading account using our referral link and start trading.
- 💡 Use coupon code: FREE during checkout.
- 📅 After 7 days of active trading under our referral link, you’ll get access to this tool in your account.
- ⚠️ Keep trading to keep access free — if you're inactive for 7 days, your access will be removed.
- 👉 Already have an account? You can change the IB (introducing broker) to our referral link and still qualify!

0 Comments